
The changing (and perhaps surprising) geography of diabetes
Diabetes is growing much faster in South Asia and Africa than in Europe or North America.

Which country has the highest rates of diabetes? Many people would guess the United States. Perhaps Canada or Australia? Mexico? The United Kingdom?
According to the International Diabetes Federation, it’s Pakistan.
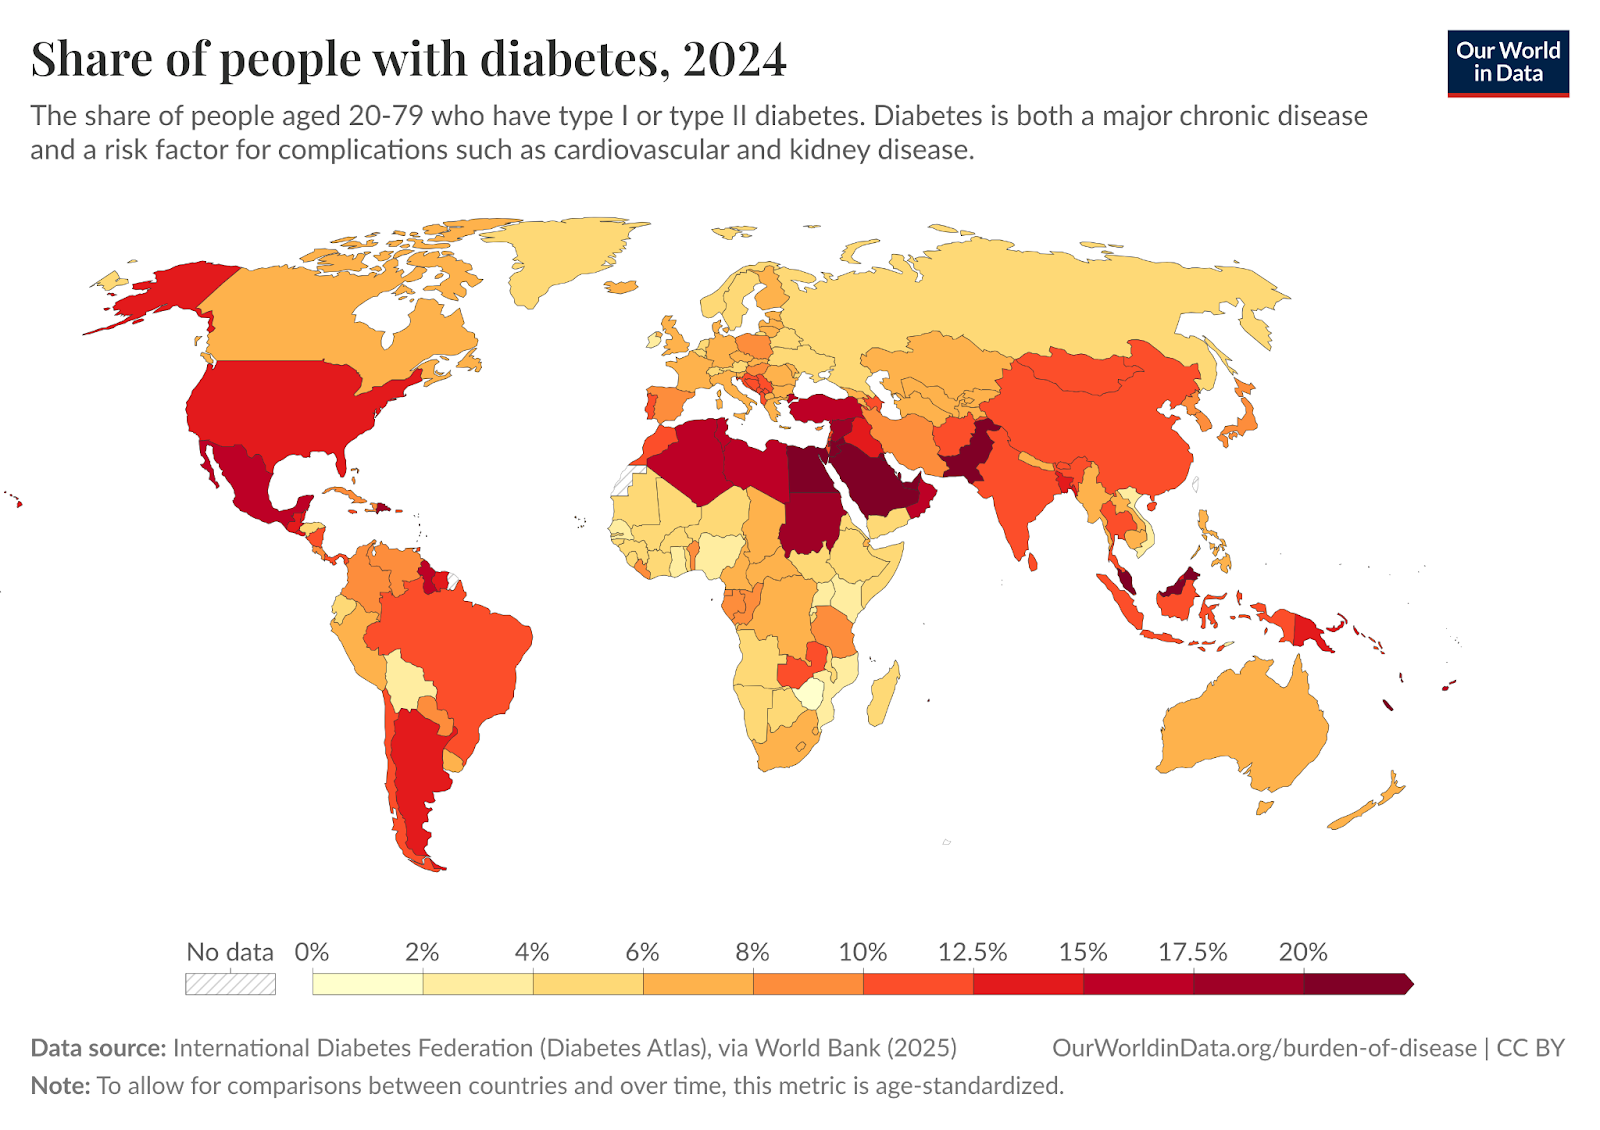
Take a look at the map below, which plots the prevalence of diabetes among 20 to 79-year-olds.
Now, this data is what we call “age-standardised”. The risk of diabetes, like many diseases, increases with age. So if we were to map the raw (or crude) rates of diabetes, it would strongly reflect how old populations are.
To understand changes in prevalence and risk beyond aging, we use age-standardised metrics that hold the age structure of the population constant over time and across countries. It imagines that the age distribution of every country is the same.
“Diabetes” here includes both type I and type II, but the vast majority of cases are type II. And it doesn’t reflect diabetes diagnoses across the population. Why this matters will become clear later. They are estimates of how common it is based on blood glucose surveys among smaller, representative populations.
Countries like Pakistan, Saudi Arabia, Egypt, Malaysia and a number of Pacific island states have very high rates of diabetes. Pakistan’s share is more than double that of the United States and four to five times that of most European countries.
Why?
Diabetes is a disease where the body cannot properly regulate blood sugar levels. It fails to do so because the body becomes resistant to insulin, the hormone that allows cells to take up glucose. Obesity is the largest modifiable risk factor for type II diabetes because excess fat — in particular, visceral fat — increases insulin resistance.1
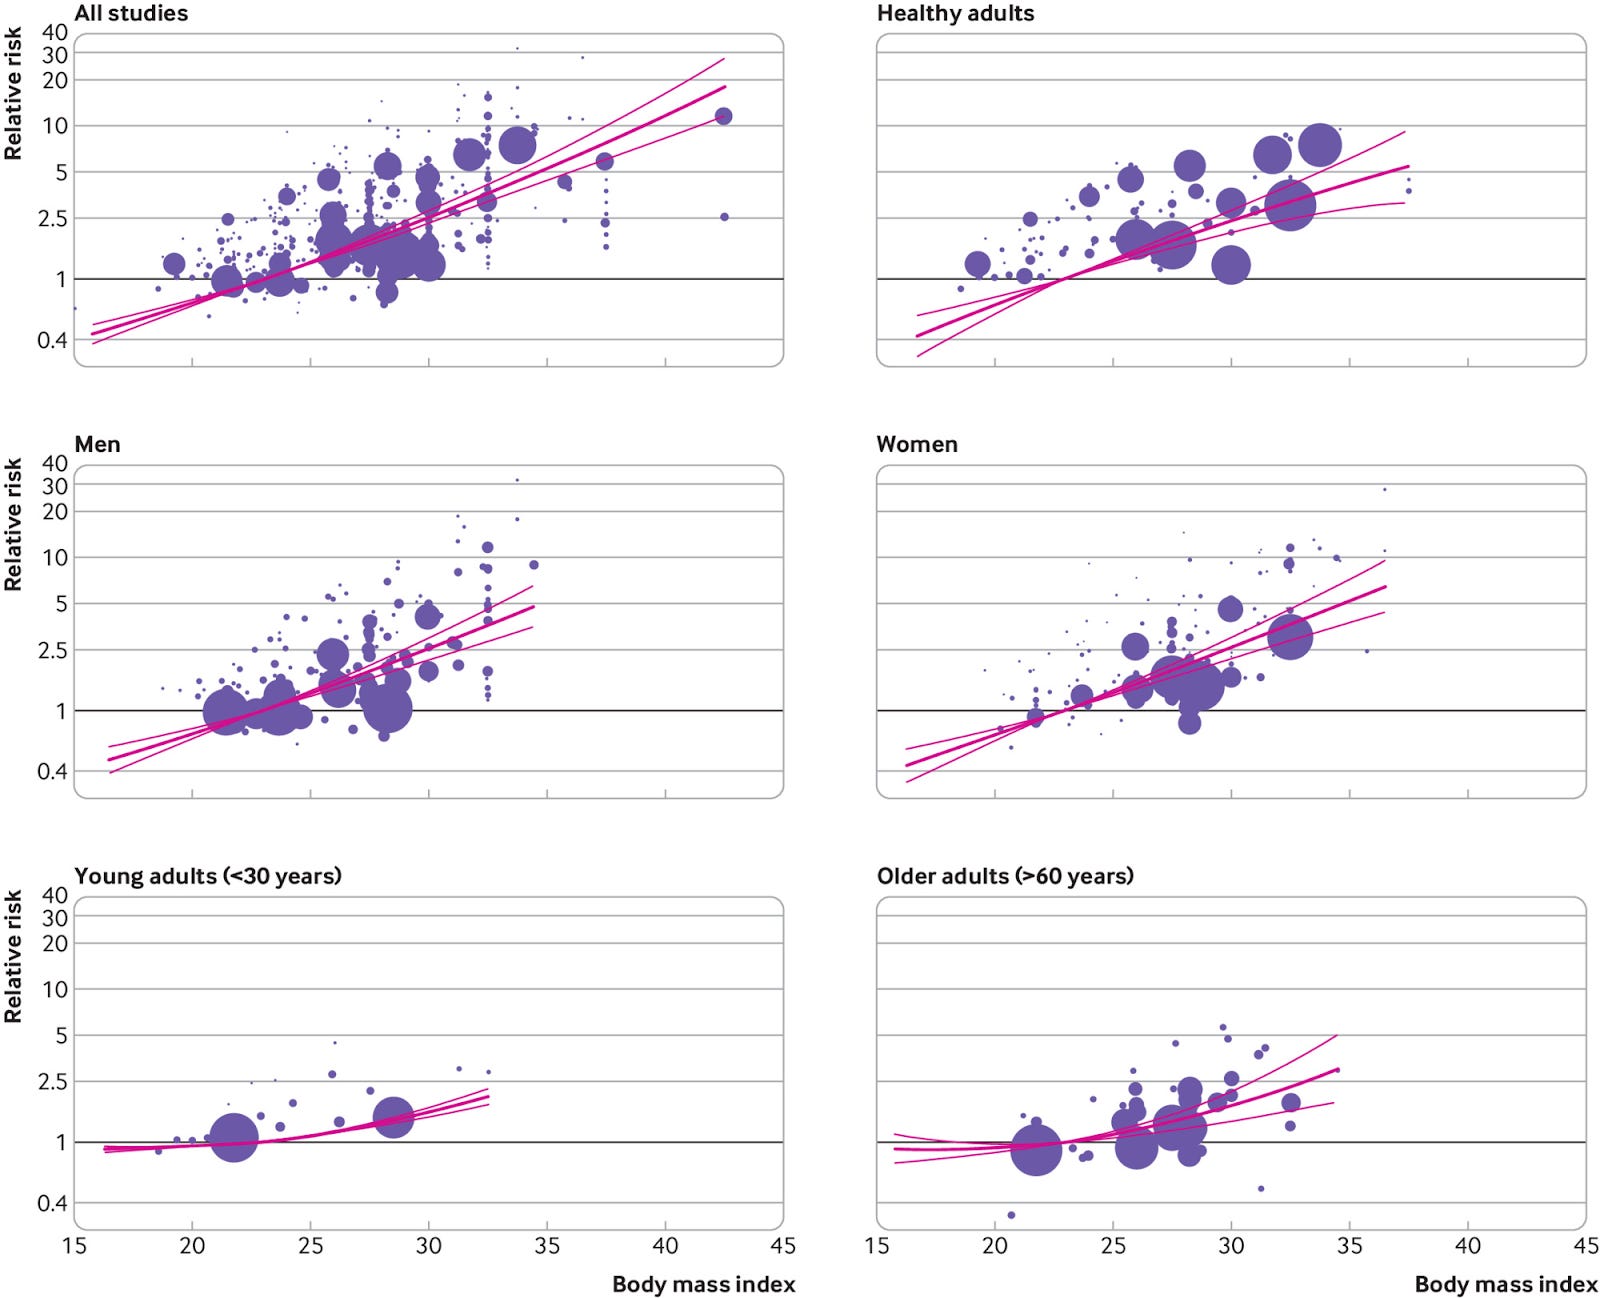
Below, you can see the relationship between body mass index (BMI) and the relative risk of developing diabetes across studies involving millions of individuals.2 It’s not a perfectly straight line (for some reasons I’ll come on to), but the relationship is strong.
While obesity was mostly a Western (or rich country) problem 20 to 30 years ago, it isn’t anymore.
A growing share of populations across Asia, Africa, South America, and the Middle East are overweight. This often happens while many are still underweight and undernourished (the double, or even triple, burden of malnutrition). In some countries, this rise in obesity has been rapid, far faster than the historical rise in rich countries.
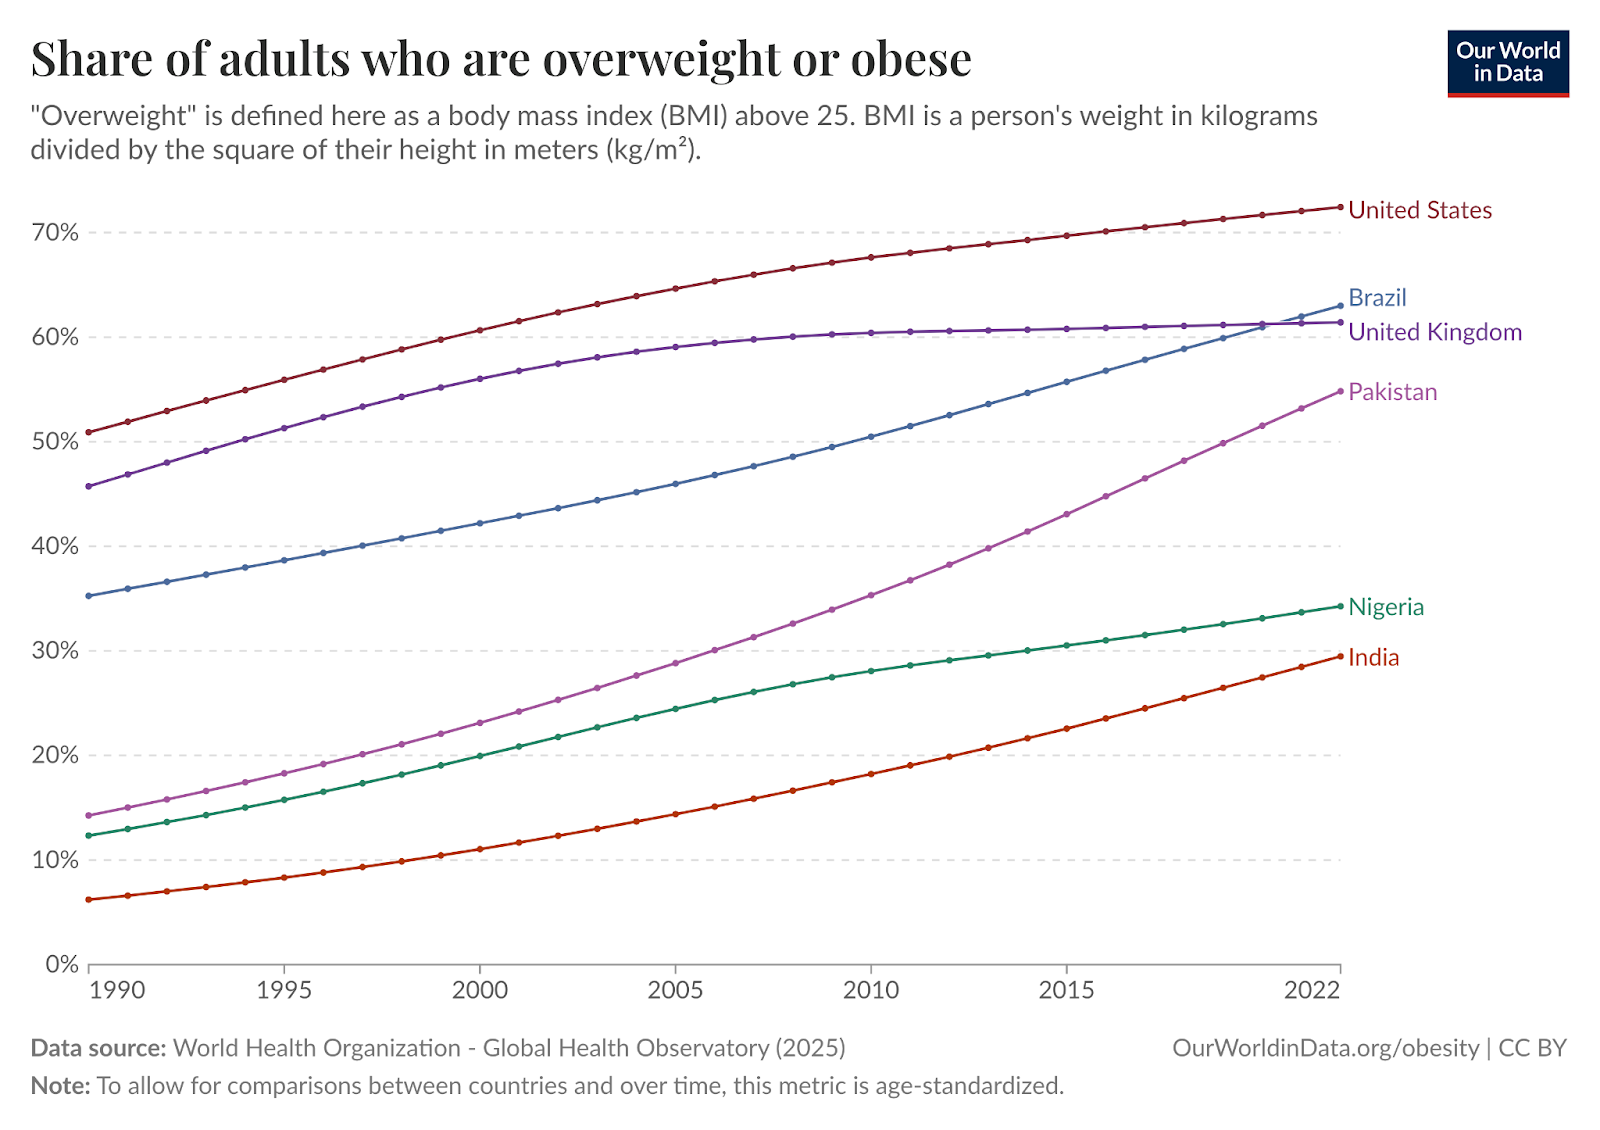
So that is the first explanation: obesity has been rising quickly in countries like Pakistan, India and Malaysia. But that can’t be the full explanation: their obesity rates are growing, but they’re still lower than the US or the UK. How can diabetes rates be two, three, or even four times higher?
The risk of developing type II diabetes if you’re overweight depends on other factors. One is ethnicity.
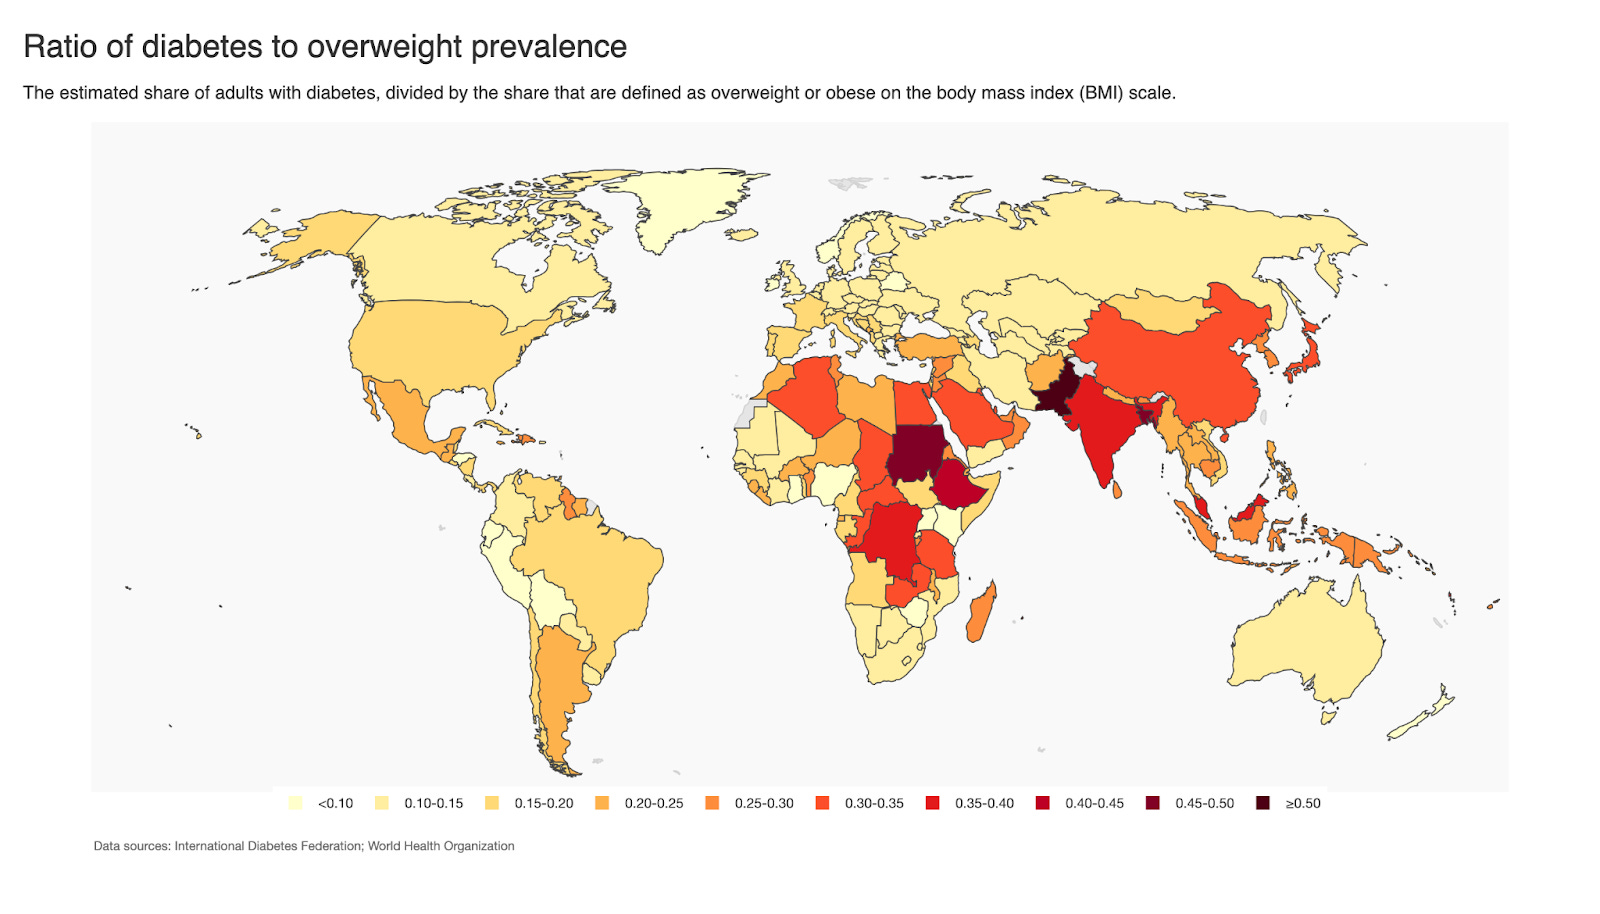
Let’s plot the ratio of the prevalence of diabetes to the prevalence of being overweight. This helps us isolate differences in vulnerability or susceptibility to developing diabetes, independent of obesity rates.
A higher ratio means someone would be more likely to develop diabetes in that country if they’re overweight. On this map, Asia (particularly South Asia), North Africa and Sub-Saharan Africa are flashing red. Based on these ratios, we might say that someone in South Asia is three or even four times more likely to develop diabetes if they’re overweight than someone with a European genetic background.
That is perhaps oversimplistic, but it’s broadly in line with what we find from the medical research. People from South Asia, in particular, are more likely to develop diabetes at a lower BMI than Europeans or North Americans. This is reflected in many national dietary guidelines. The UK’s National Health Service, for example, uses different BMI scales depending on a person’s ethnicity. As they explain in their calculator:
“The calculator will also ask for information on your ethnic background. This is because people from an Asian, Black African, African-Caribbean or Middle Eastern ethnic background have a higher chance of developing health problems at a lower BMI. When you enter information on your ethnic background, the calculator will give you more accurate advice about your BMI result.”
When I select “White” as my ethnic background, it tells me that a healthy BMI range is between 18.5 and 24.9. When I select “Asian or Asian British”, my healthy range is narrower: just 18.5 to 22.9.
The UK NHS basically says that, if you’re white, you’re overweight if you have a BMI of 25 or more. But if you’re from an Asian background, it’s 23.
There are a couple of (at least partial) explanations for why this might be the case. First, for a given BMI, some ethnicities tend to have higher overall body fat percentages. Second, where that fat is stored matters. South Asian populations, for example, tend to have more visceral (or abdominal) fat, which accumulates around key organs and is particularly bad for insulin resistance. Even if Europeans had the same amount of fat, more of it is stored subcutaneously — that is, the pinchable fat on someone’s stomach, thighs, and arms — which is less metabolically harmful.
As a sidenote, this distinction is one reason why men are at a higher risk of chronic diseases like heart disease, stroke, and diabetes (and don’t live as long). They’re more likely to accumulate visceral fat. It’s not uncommon to see men with relatively skinny arms and legs have a protruding belly.3 Women hold much more subcutaneous fat, which is actually much better metabolically.
Exactly why there is this genetic lottery when it comes to fat distribution and chronic health risks is not clear to me. While there are a range of hypotheses in the scientific literature, I couldn’t find a clear answer.
These differences matter for how we understand the shifting burden of diabetes (and other metabolic diseases). The geography of diabetes is changing faster than many health systems are prepared for. In countries where diabetes risk rises at lower levels of body fat, even modest increases in overweight can translate into large increases in disease. This is happening in countries where getting a diagnosis is difficult, and getting treatment is even more so.
That means most of the global burden is invisible. The longer these cases go untreated, the harder they are to treat and reverse.
This is not the case for type I diabetes.
Jayedi, A., Soltani, S., Motlagh, S. Z. T., Emadi, A., Shahinfar, H., Moosavi, H., & Shab-Bidar, S. (2022). Anthropometric and adiposity indicators and risk of type 2 diabetes: systematic review and dose-response meta-analysis of cohort studies. Bmj, 376.
In Scotland, we call this a "beer belly".
Two other factors next to ethnicity that may explain the different ratios of obesity to diabetes across the world:
1) muscle mass: having more muscle raises your BMI, but improves your sugar metabolism thus decreasing the risk of diabetes. Muscle mass depends on protein intake, which is likely to be lower in South Asia, on amount of physical exercise (not obvious whether this makes a difference across geography), and probably also on genes (Asians may be naturally less muscular)
2) diet: insulin resistance is triggered especially by foods with a high glycemic load, such as sugary soft drinks, white flour and rice. Poorer countries may be consuming more of such "cheap" calories than richer ones.
Thanks for bringing up disease risk. You usually write about energy, minerals, agriculture, technology, etc, but this post points to how all of our systems of civilization have an effect on people and their health. Implicit in your post are the dynamics of agriculture, globalization, and industrialization that drive the rise of metabolic disease.