

Pensions are not my usual bag, but it’s what we’re running the numbers on today. They’ve been in the headlines in the UK following the Prime Minister, Andy Burnham’s, proposal to change the controversial “triple lock” system that has determined how quickly British pensions have increased over time.
I’ve seen lots of coverage and debate, but almost every time, I am screaming inside, “Just show me the chart!” That’s what I’ll try to do here.
For my many non-British readers, I hope you’ll also find it interesting. Pensions, social care, and the economics of ageing populations are issues that many countries will have to deal with over the coming decades. At the end, I’ll draw on some international comparisons on pensions, too.
What’s happened to British pensions over the past 50 years?
The whole debate in the UK is about what to do with the so-called “triple lock” on pensions. I’ll get to what that is soon.
But to understand why this triple lock exists, we need to look at what happened to state pensions in Britain in the 1980s and 1990s.
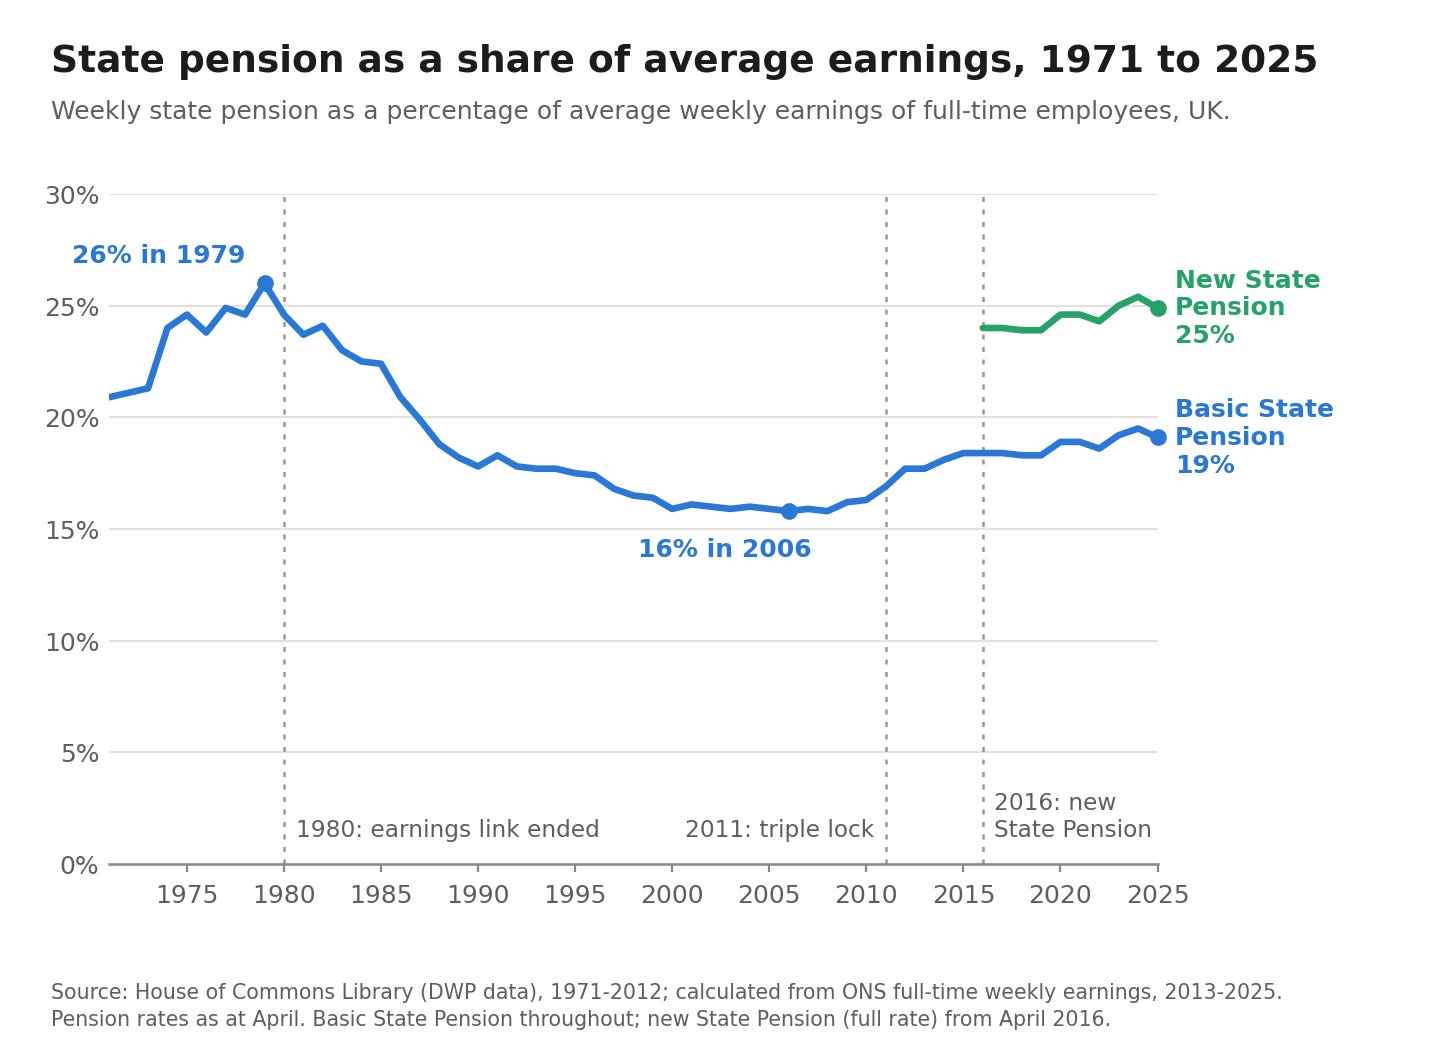
In the chart below, I’ve shown the state pension as a percentage of the average weekly earnings of full-time employees in the UK. So, in 1979, the state pension was equivalent to 26% of the average worker’s earnings.
But you can see that this dropped in the 1980s and 1990s, reaching a low of just 16% in 2006. During this period, the pension rose in line with inflation, but strong economic growth meant that it fell well behind earnings. The triple lock was introduced to address that.1
Since 2016, new retirees have received the “new” state pension, which is higher than the older basic state pension, so you see two lines on the chart. The triple lock applies to both, but the new state pension started at a higher level.
What is the triple lock?
When you hear people try to explain the triple lock on the news, they often make it sound quite complicated. In practice, it’s quite simple.
Every April, the government increases the UK state pension. The size of this increase is the largest of the following:
Inflation
The increase in average earnings
A 2.5% floor
So it rises by at least 2.5% per year (the floor). But if either inflation or the increase in earnings is more than 2.5%, then it increases by whatever is highest.
Let’s say inflation was 4% and average earnings increased by 3%. The state pension would increase by 4%. If both of these were 1%, it would increase by 2.5% (reverting to the floor).
The adoption of the triple lock has led to a rebound in pensions’ share of earnings. Let’s look at that previous chart again: you can see it increases from its low of 16% back up to 19%.
How does the increase in pensions compare to average earnings?
There are a few reasons why people don’t like the triple lock mechanism.
The first is that pensions have outpaced earnings by quite a bit over the last decade or so. In the chart below, you can see how the state pension, average earnings, and prices (basically a marker of inflation) have changed since 2000. The values are indexed to the year 2010 (which is given a value of 100).
You can see that pensions have outpaced both earnings and prices.
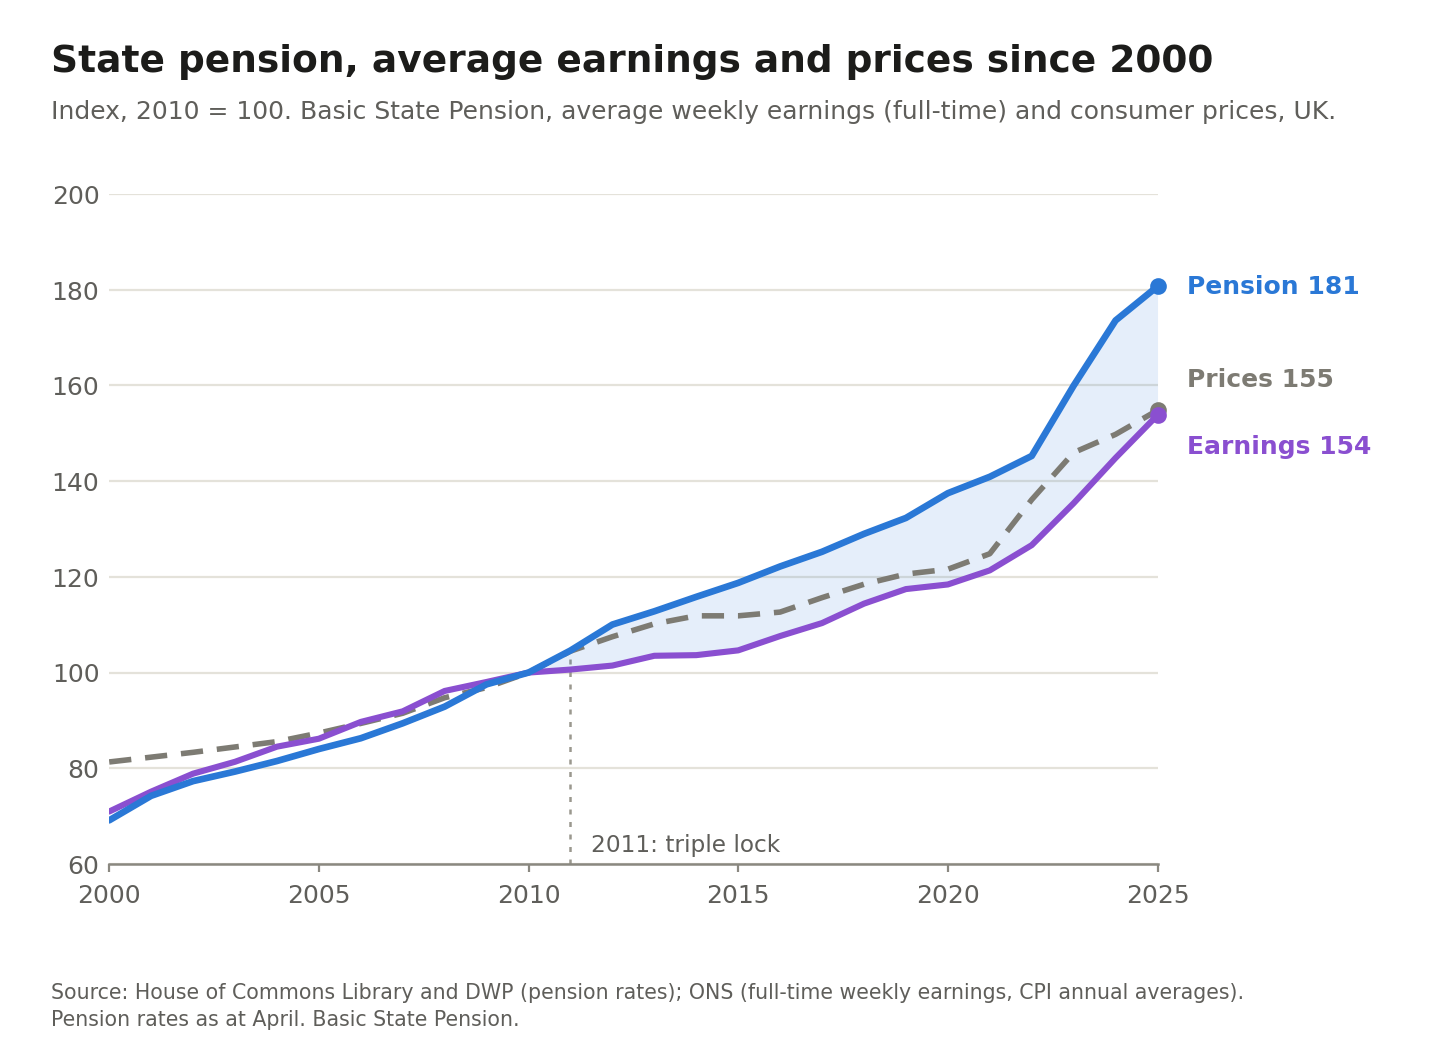
Now, when you first look at this, one initial reaction is “Oh, if it has outpaced both prices and earnings, perhaps pensions have increased in line with the 2.5% floor in most years, and both inflation and earnings have been less than this”.
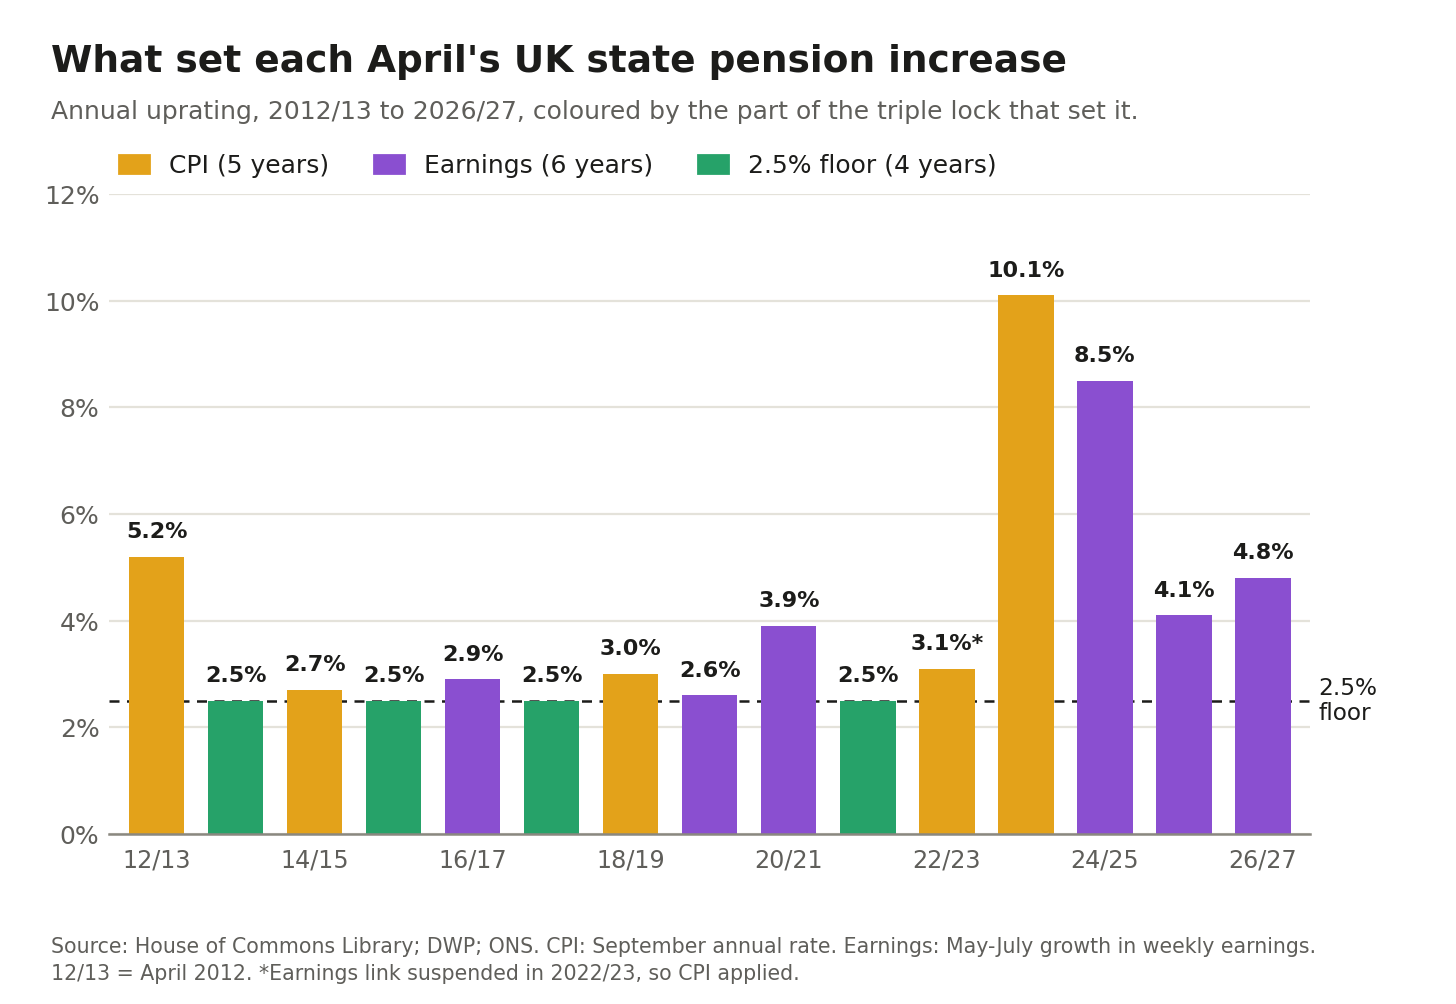
Perhaps surprisingly, the 2.5% increase was the least common. In the chart below, I’ve plotted the growth in pensions each year since the triple lock, coloured by which of the three locks was responsible for the increase.
Earnings were actually the most common: it pinned the increase for six years. Then inflation for five years (including 2022, when the triple lock was temporarily suspended), and the 2.5% floor in four.
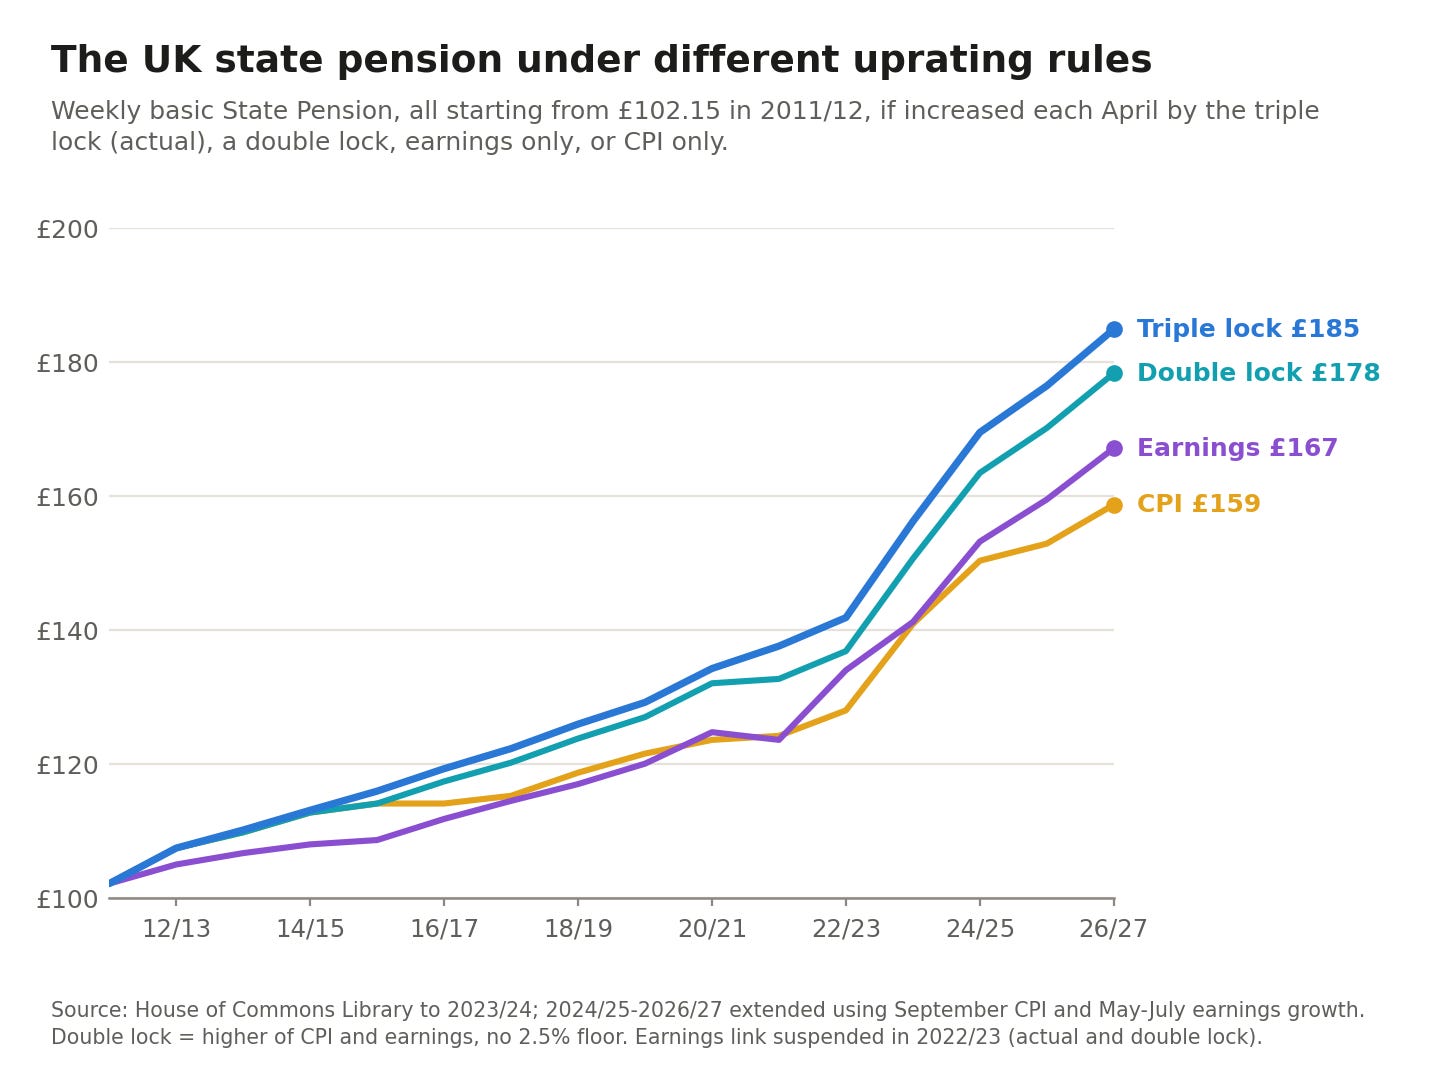
Perhaps an even clearer way of seeing this is to look at how the pension would have changed under different rules. In the chart below, we see how pensions have changed in the triple lock scenario, as shown by the blue line.
If it had only increased in line with inflation (CPI), it would be the lowest of the scenarios. In line with earnings, a bit more, but still less than with the triple lock.
And instead, if it had been a double-lock approach, which removed the 2.5% floor and set the increase based solely on whether earnings or inflation was higher. The double lock is not that far from the triple lock, suggesting that the 2.5% floor wasn’t doing much to drive this increase.
What’s wrong with the triple lock?
Why, then, have pensions diverged so much from inflation and earnings, if these are setting them most of the time?
The reason is what economists (and critics) call “ratcheting”. Earnings and inflation rarely move together: when the economy (including earnings) is strong, inflation is often low, and vice versa. It’s not that common for both to be strong at the same time.
If pensions are always set by the stronger one, you get this ratcheting effect, where every year is a “good” year, and it’s never hindered by a weak one. I’ve drawn a hypothetical of this below. If inflation and earnings alternate between 5% and 1% growth, they’re always tempered by their 1% years. Pensions, though, consistently grow at 5%, outpacing both.
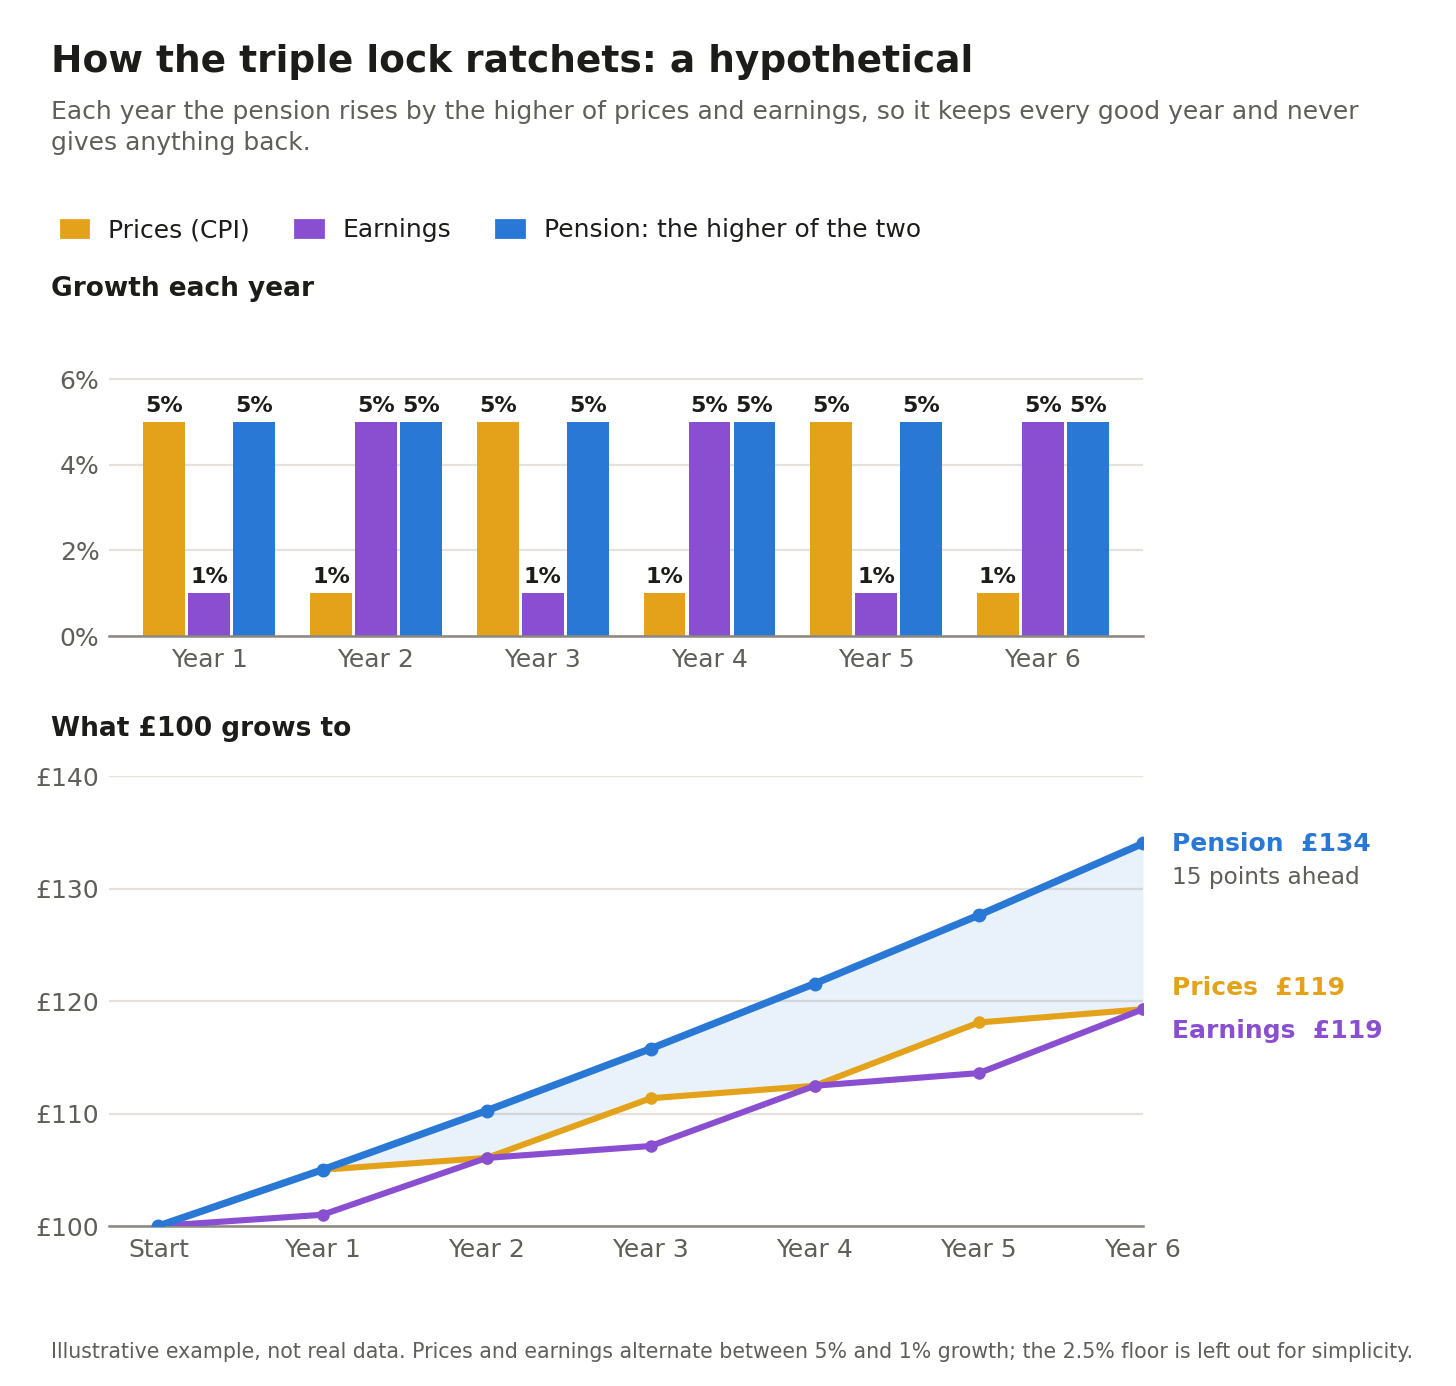
This ratcheting effect is one of the objections to the triple lock.
The other is the uncertainty that it introduces. It tracks several very volatile macroeconomic numbers. That makes it very difficult to forecast government (and taxpayer) costs. It also makes it difficult for pensioners themselves to know what to expect from year to year.
The pensions that people end up with are, to some extent, based on luck. They’re not set based on the principle of how much we think pensioners should get, or how much we think they might need to live on.
Just to bring these two critiques together: the Institute for Fiscal Studies (IFS) estimates that keeping the triple lock would cost an additional £20 billion a year by 2050. But this ranges from £5 billion to £40 billion because we really have no idea how inflation and earnings will change decades from now.
What’s the government’s proposal to change the triple lock?
A few days ago, the UK’s Prime Minister, Andy Burnham, announced a proposal to change the triple lock. Nothing would change within this Parliament, but might be put in place in 2030.
Many media outlets and commentators have called this a change from a triple lock to a “double lock”.
But the proposal is still really a triple lock. It still has all three components: the 2.5% floor, inflation, and earnings. It’s just that earnings are treated slightly differently.
The specifics of the new system are not fully fleshed out, but my read is that pensions would be set primarily by either the 2.5% floor or inflation (whichever is higher). That sounds like a double lock. But earnings do come in somewhere.
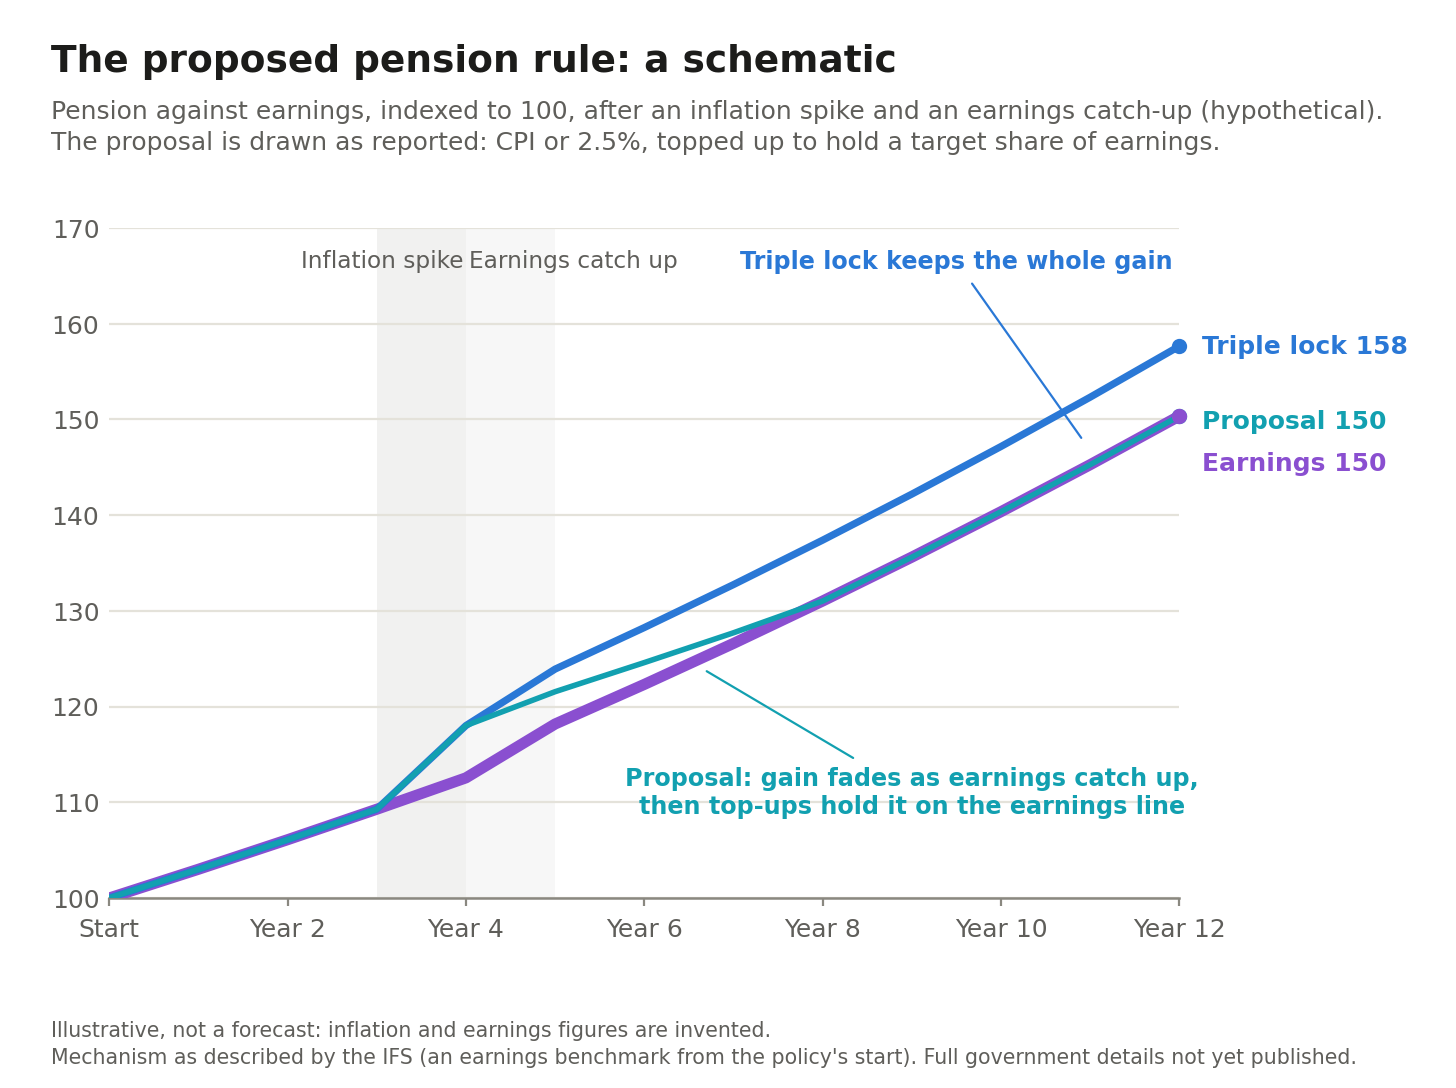
Today, the link to earnings is how earnings increased last year. The new proposal asks whether pensions have kept pace with earnings over the longer term, since 2030. It keeps in mind a counterfactual scenario in which pensions since 2030 had only kept up with earnings. If the pension falls below this, it’s topped up. If it’s above it, it continues to rise by the CPI or 2.5% floor while earnings catch up.
There is no firm guarantee that earnings do catch up — or, rather, no mechanism that forces this to be the case. But history suggests that periods of higher inflation are followed by earnings growth, a pattern we might expect to repeat.
In the schematic, we can see how this might work, and how pensions would converge with earnings over time.2
How much does the triple lock cost, and how much might we “save” by changing it?
The IFS estimates that, because of the triple lock, the UK now pays an additional £16 billion a year in pensions compared with a scenario in which pensions were linked solely to earnings.
For context, the country spends around £154 billion on state pensions, so the triple lock has added around 10% to the annual bill.
It estimates that if the country had the new proposed triple lock scheme instead of the old one, our spending this year would be about £9 billion lower. So, we’d still be paying around £7 billion more than if it had only tracked earnings, but £9 billion less than we do now.
How much less might we be paying in the future if this change gets implemented?
The government says it will save £15 billion a year by 2040. Adjusted for inflation, that’s closer to £11 billion in today’s prices. Again, I think that comes with a huge asterisk because of the uncertainty of future inflation and earnings.
Andy Burnham’s proposal is to use these savings to increase crucial funding for social care. By the mid-2030s, it’s estimated to cost around £18 billion (roughly) more than it does today, just to maintain the same level of care.3
That’s going to be a problem. Any savings from the triple lock reform will increase over time. By the mid-2030s, they’re still going to be small (probably less than £5 billion). So, there’s a mismatch in timing: social care funding will need to ramp up well before the larger savings from pension reform arrive.
If social care is to be fully funded, the money will need to come from somewhere else. In a future post, I might look at some options to get a sense of scale for what it would take.
How generous is the UK pension?
It’s worth stepping back to see how UK pensions compare to those in other countries.
The system varies widely, with some relying much more on public state pensions and others on private ones. So keep in mind that there might be some nuance or specifics for individual countries that aren’t captured here.
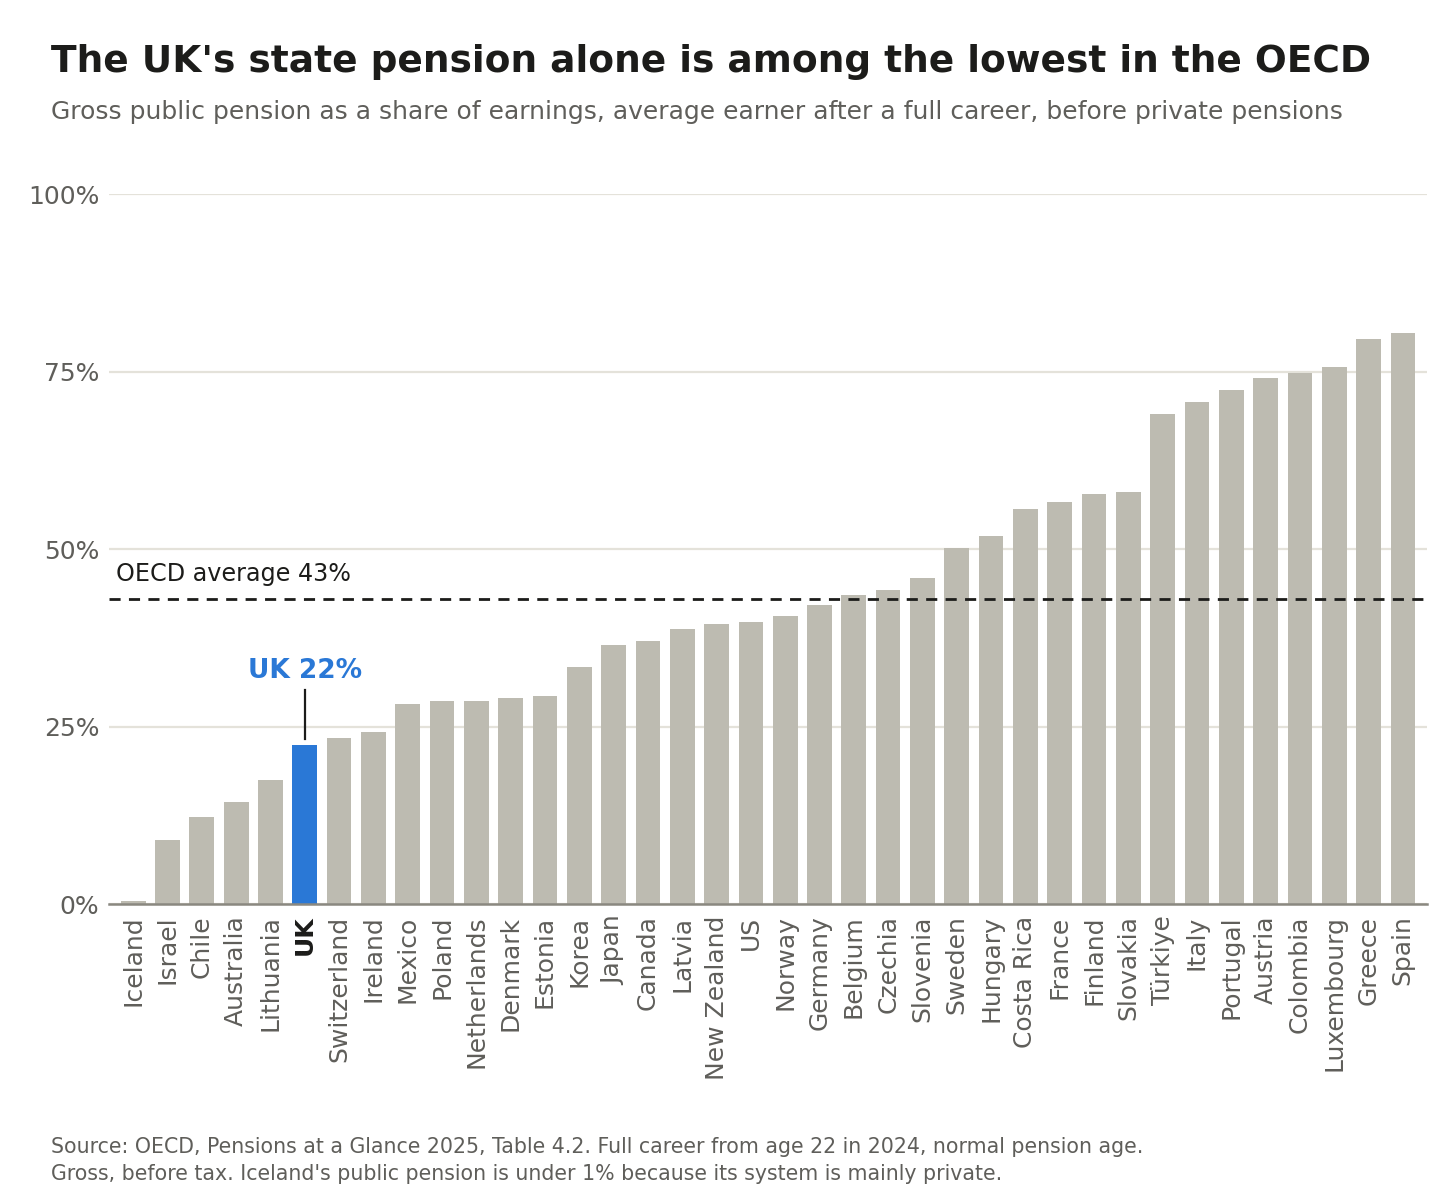
If we only look at the state pension, the UK is not particularly generous. Below are the rankings for OECD countries. This is given as a share of average earnings.
The UK is pretty close to the bottom, with the state pension being equivalent to just 22% of average earnings.
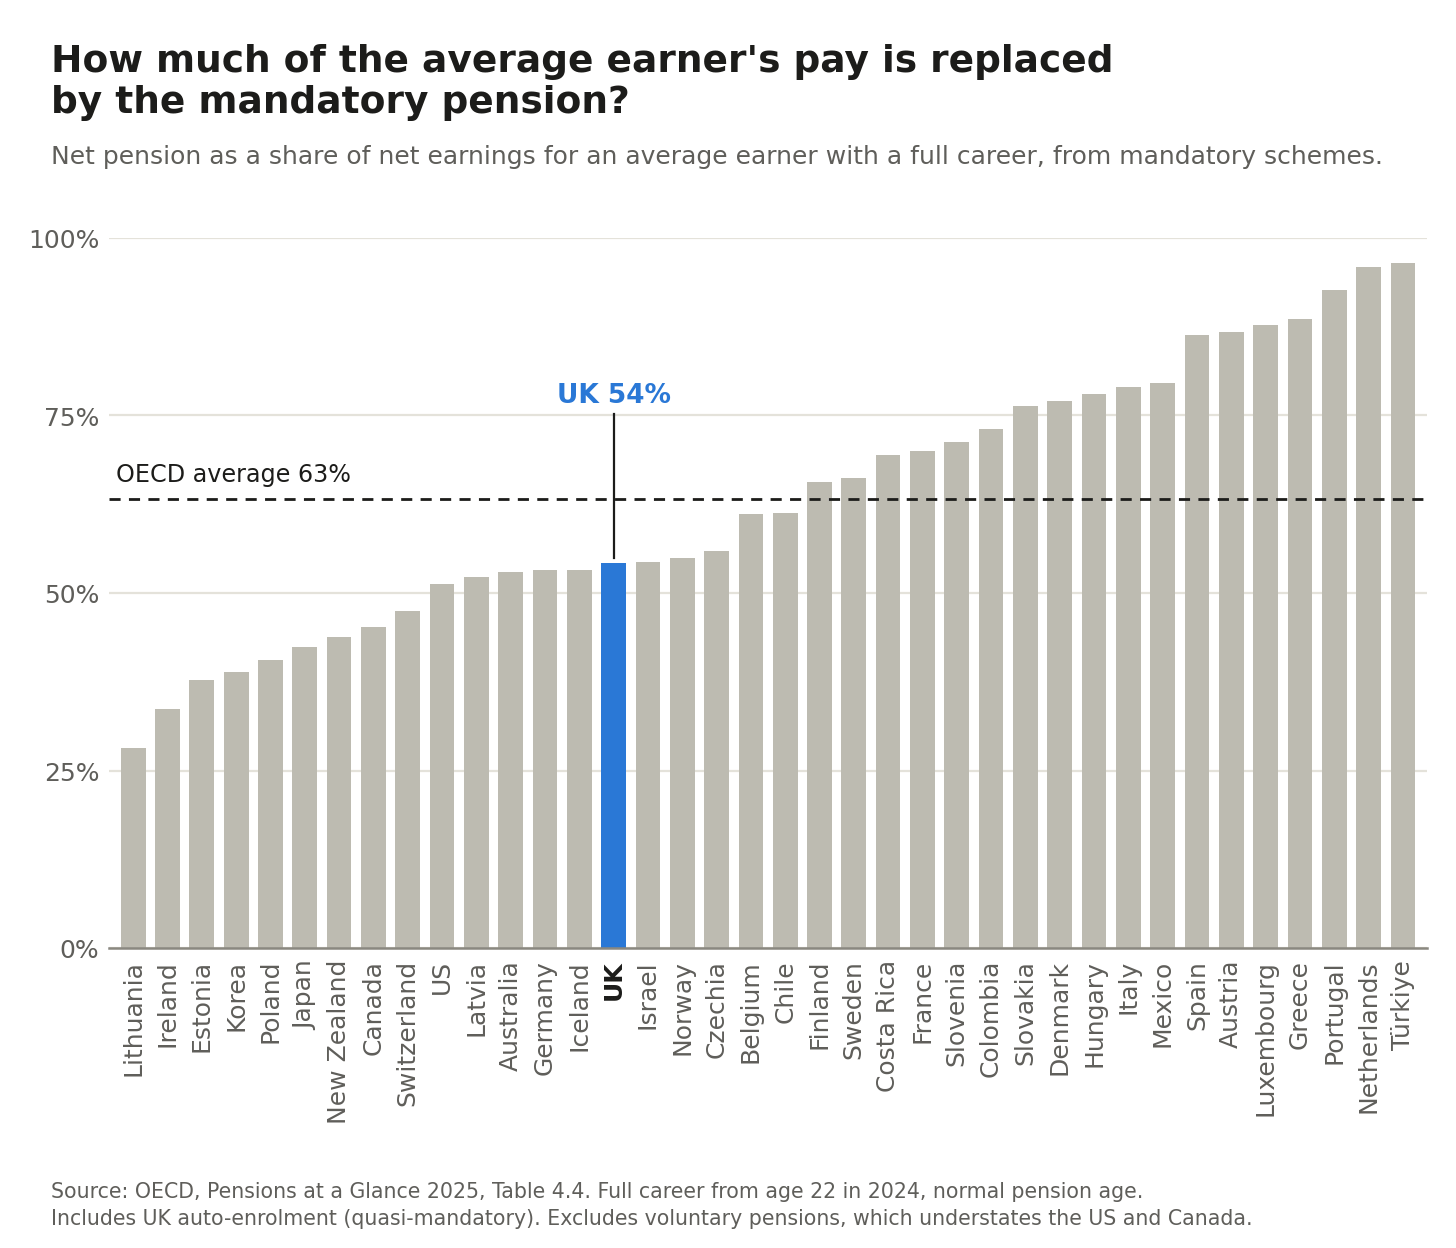
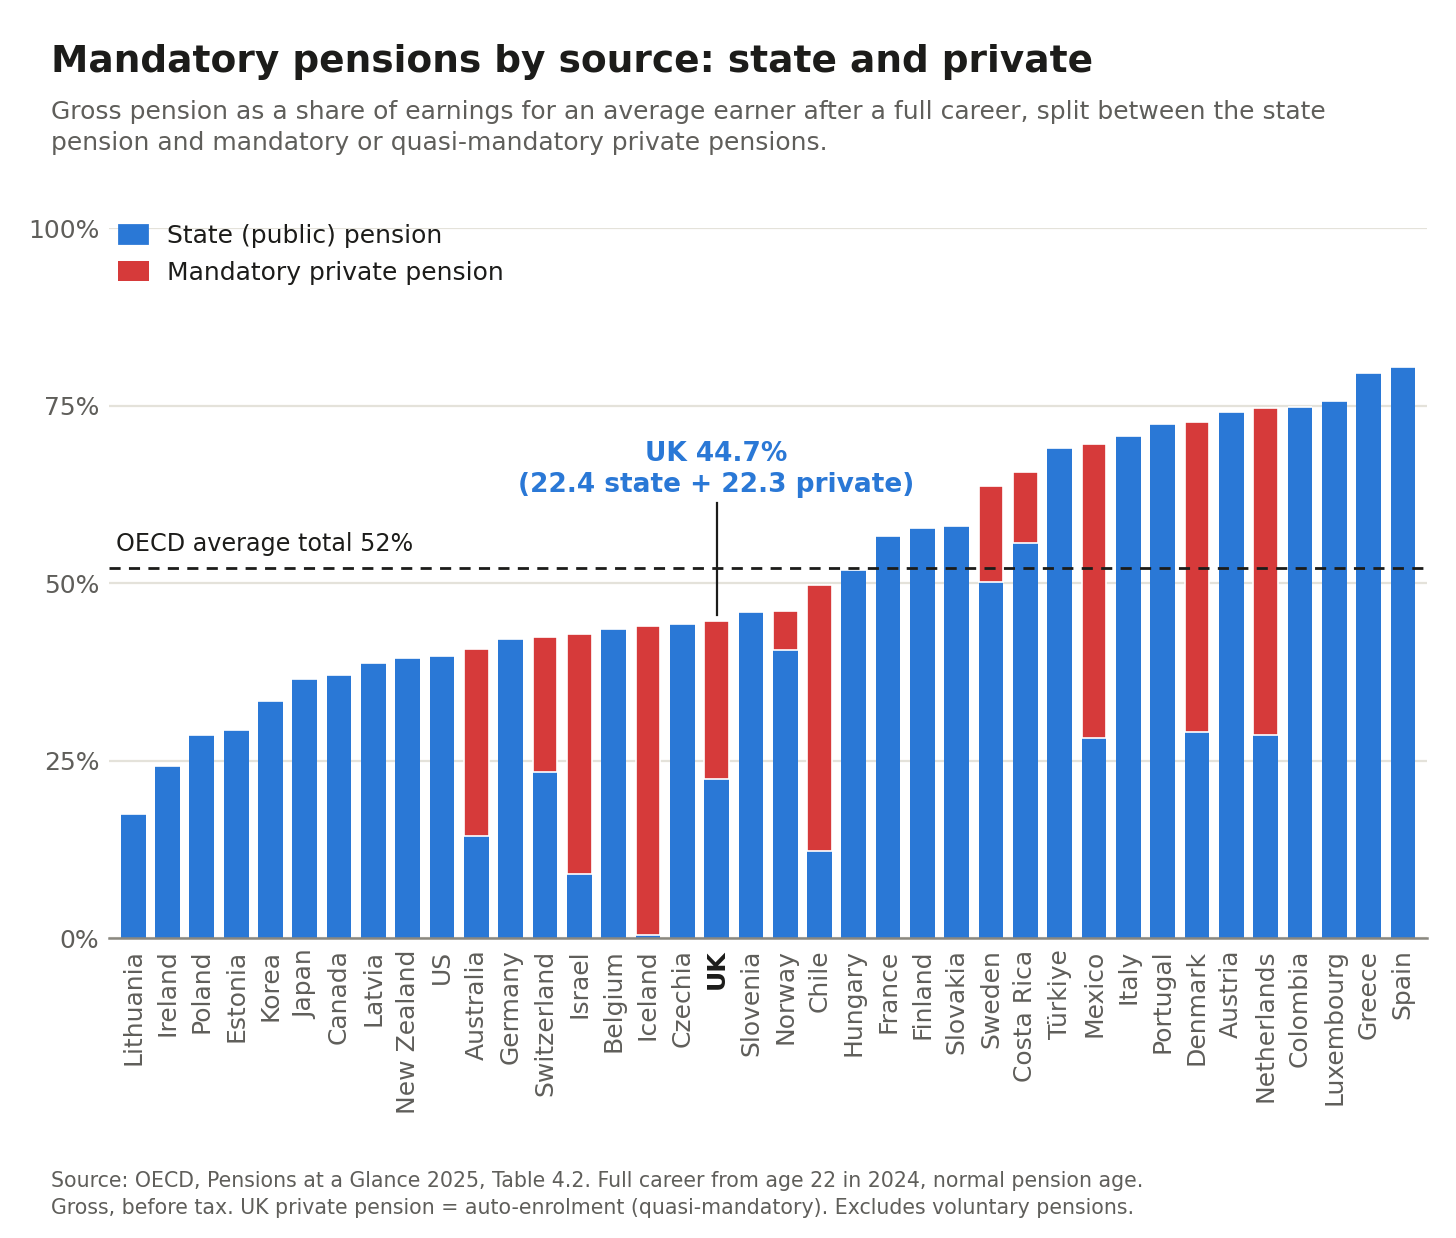
But the UK does have a somewhat mixed pension scheme. Yes, there is the flat-rate state pension, but it also relies a lot on auto-enrolment in private schemes (so we might call it quasi-mandatory). When this is added, it brings it up to around 54% of average earnings after tax (about 45% before tax, which we’ll see in the final chart). This figure differs from all the ones above, which focused solely on the state pension, paid for by taxpayers.
That puts it around the middle of the pack in the chart below.
Finally, we can see the breakdown of this pension between the state and the mandatory private enrolment. This is gross (before tax), but still captures the dynamics clearly.
Most countries rely far more on state pensions, but some other countries, including Switzerland, Australia, Denmark, and the Netherlands, have large contributions from these mandatory private contributions.
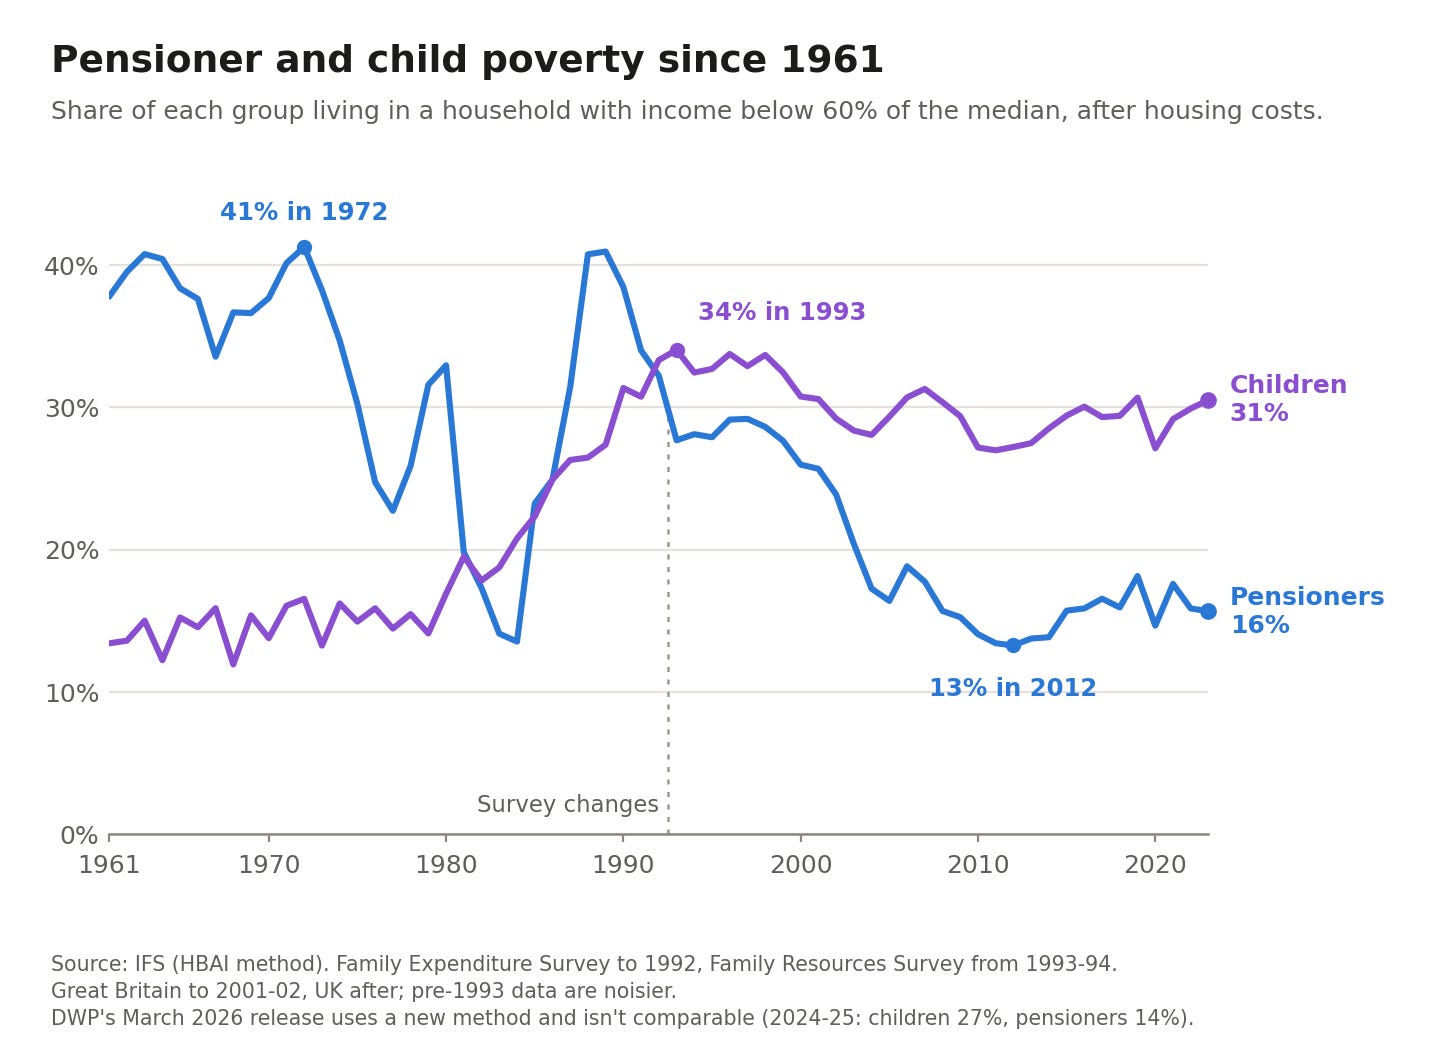
Relative poverty rate among pensioners has fallen quite a bit. Childhood poverty moved in the opposite direction, and is now twice the rate among pensioners.
Again, the specifics haven't been announced, so this is mostly an informed inference from experts of how this would work.
This £18 billion is not the official government estimate; it’s an older estimate from the IFS. So, it’s not precise, but it gives a sense of magnitude.
Thank you. 70yo here. Im always pleasantly surprised to get £1,000 a.month for doing nothing. I genuinely believe my generation has spent our whole lives 'never having had it so good' year on year. We had rock n roll, the pill, freedom of speech, economic growth, improved health and secutity the NHS, free university education. An easy comfirtable life. I'll happliy take a little reduction in that to help the poor kids who can't afford a roof over thier heads now and zilch possibility of continuing exponential economic growth in their futures.
I, too, was reading the news thinking SHOW ME THE CHARTS so thank you very much for this excellent analysis.