
Tracking global food production through a record El Niño
An interactive tool to explore historical data on food production, and updated forecasts from the USDA.

This summer has been a hot one for many countries. With an extremely strong (and potentially record-breaking) El Niño on the way, next year is likely to be even hotter. If you’re interested, Zeke Hausfather at the Climate Brink has a very good article on how that is developing.
Two of my biggest concerns when it comes to climate change are the direct impacts of extreme heat and the impacts on food production. I’ve written a lot about both before.
If you’ve followed this Substack for a while, you’ll know that I often do periodic updates on how global food production has been faring in a warming world.
I do this by following the US Department of Agriculture’s (USDA) World Agricultural Production releases, which are updated monthly with the latest forecasts of production and yields for food products worldwide.
I usually sit and scroll through the long tables of PDFs at the end of every report to see whether things are tracking up or down, and by how much.
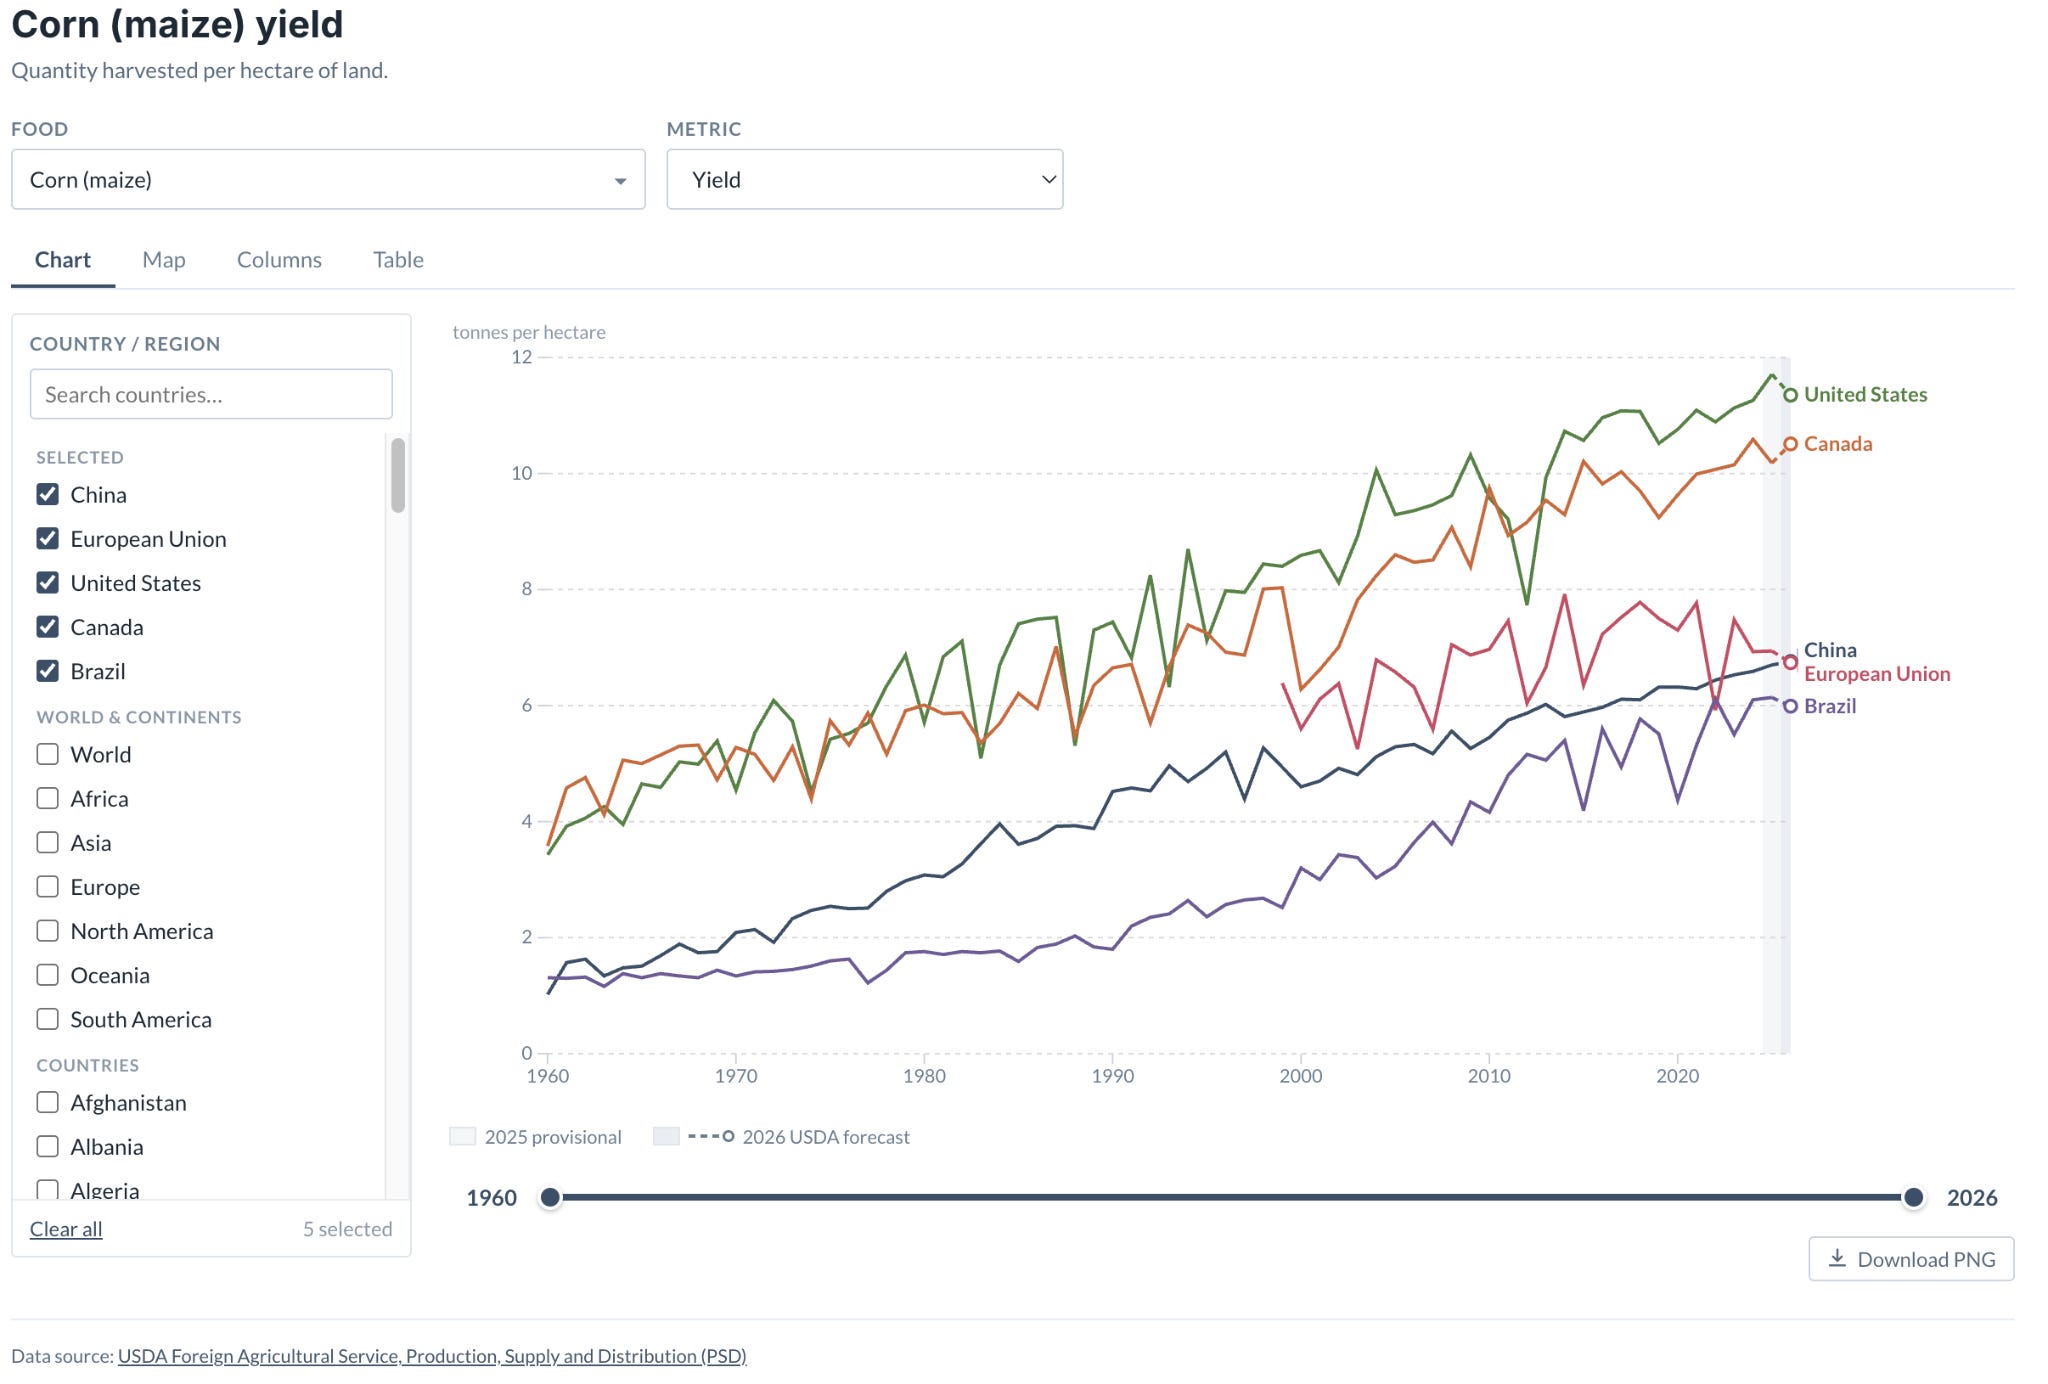
To make things easier to track, I’ve built a small interactive tool that shows historical USDA data and the latest forecast for the current year. First, for selfish reasons: so I can track what’s happening, particularly during the potentially disruptive year ahead. Second, to make this easier for anyone else who is interested in following it, too.
For any crop or animal product, you can explore more than 50 years of production, yield and harvested area data.
As a very quick overview, here is how global yields and production of four of the largest crops are tracking this year.
I guess the global summary so far would be, in one word: “fine”?1
Corn and wheat yields and production are down slightly from last year, but are the second-highest on record. Rice production looks similar, but yields may be on track for a record (albeit a very small one). Soybean production and yields are looking at a record year.
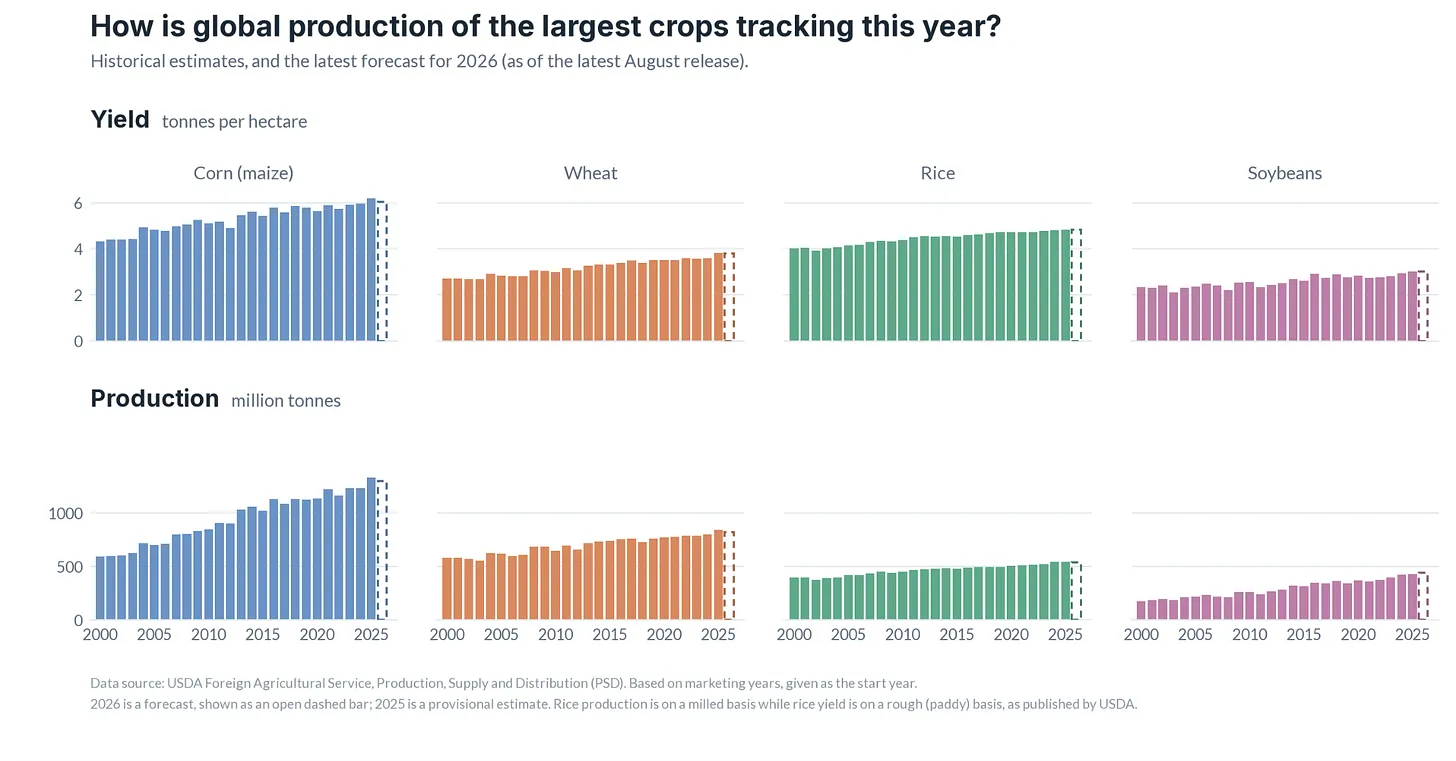
This is based on its August release; I plan to update it monthly.
It should go without saying that this does not mean yields and production were good or fine everywhere. Some countries are too small to really register in the global total. And often a bad year in one place gets partially offset by a good year elsewhere.
Hi Hannah Ritchie,
I’ve been following your insightful coverage on climate solutions and always learn a lot from your balanced perspective.
Inspired by the mechanism of past ice ages—where plankton blooms absorbed immense amounts of CO2—I recently wrote a short piece proposing a grassroots alternative to controversial industrial ocean iron fertilization:
🌿 "Hyper-Local Coastal Nutrient Recycling"
1. Restoring lost river-to-sea mineral flow using local, natural biomass (e.g., fallen leaves, dredged sediments, local shell waste).
2. Designed strictly under local community & fishery consensus to prevent toxic algal blooms (red tides).
3. Revitalizing local marine catch while sequestering carbon bottom-up.
I know ocean-based carbon removal is heavily debated, so I’d genuinely love to get your critical take: Do you see a pathway for this kind of community-led, low-tech circular approach alongside industrial marine CDR?
Here is the full post: Global Warming → How to Powerfully Cool the Earth ✨ 地球温暖化→地球を強力に涼しくする方法✨
https://mikomikojapan.substack.com/p/813
(If this perspective resonates with you or your audience, feel free to share your thoughts or restack!)
Thanks for your time and continued inspiration,
Very good tool. My comment is that for the EU, the main staples, wheat, barley, oats and corn, are all in decline. I note that global warming is affecting Europe at a faster rate than the rest of the world, so I wondered if this may be the reason? It could of course be due to a whole host of other reasons. Maybe someone has looked at this?