
What will future population change look like?
A new tool that let's you imagine different futures of where we might be headed

The huge declines in global fertility rates — and what this means for population growth and age structures going forward — gets a lot of attention these days.1
Much of these discussions use the United Nations’ population projections as the starting point.2 But these, like any demographic projection, rely on assumptions for how fertility rates, life expectancy, and migration rates will change in the future. And by future, I mean the next 70 years.
It often takes a bit of work to understand what the UN assumes in its models. And then it’s difficult for anyone who’s not a demographer to work out how things might look different if reality turns out different.
What if fertility rates fall faster or slower? What if there is no rebound in rates, like many scenarios assume? What if we see unprecedented improvements in healthcare and life expectancy, or net migration rises, or countries close their borders?
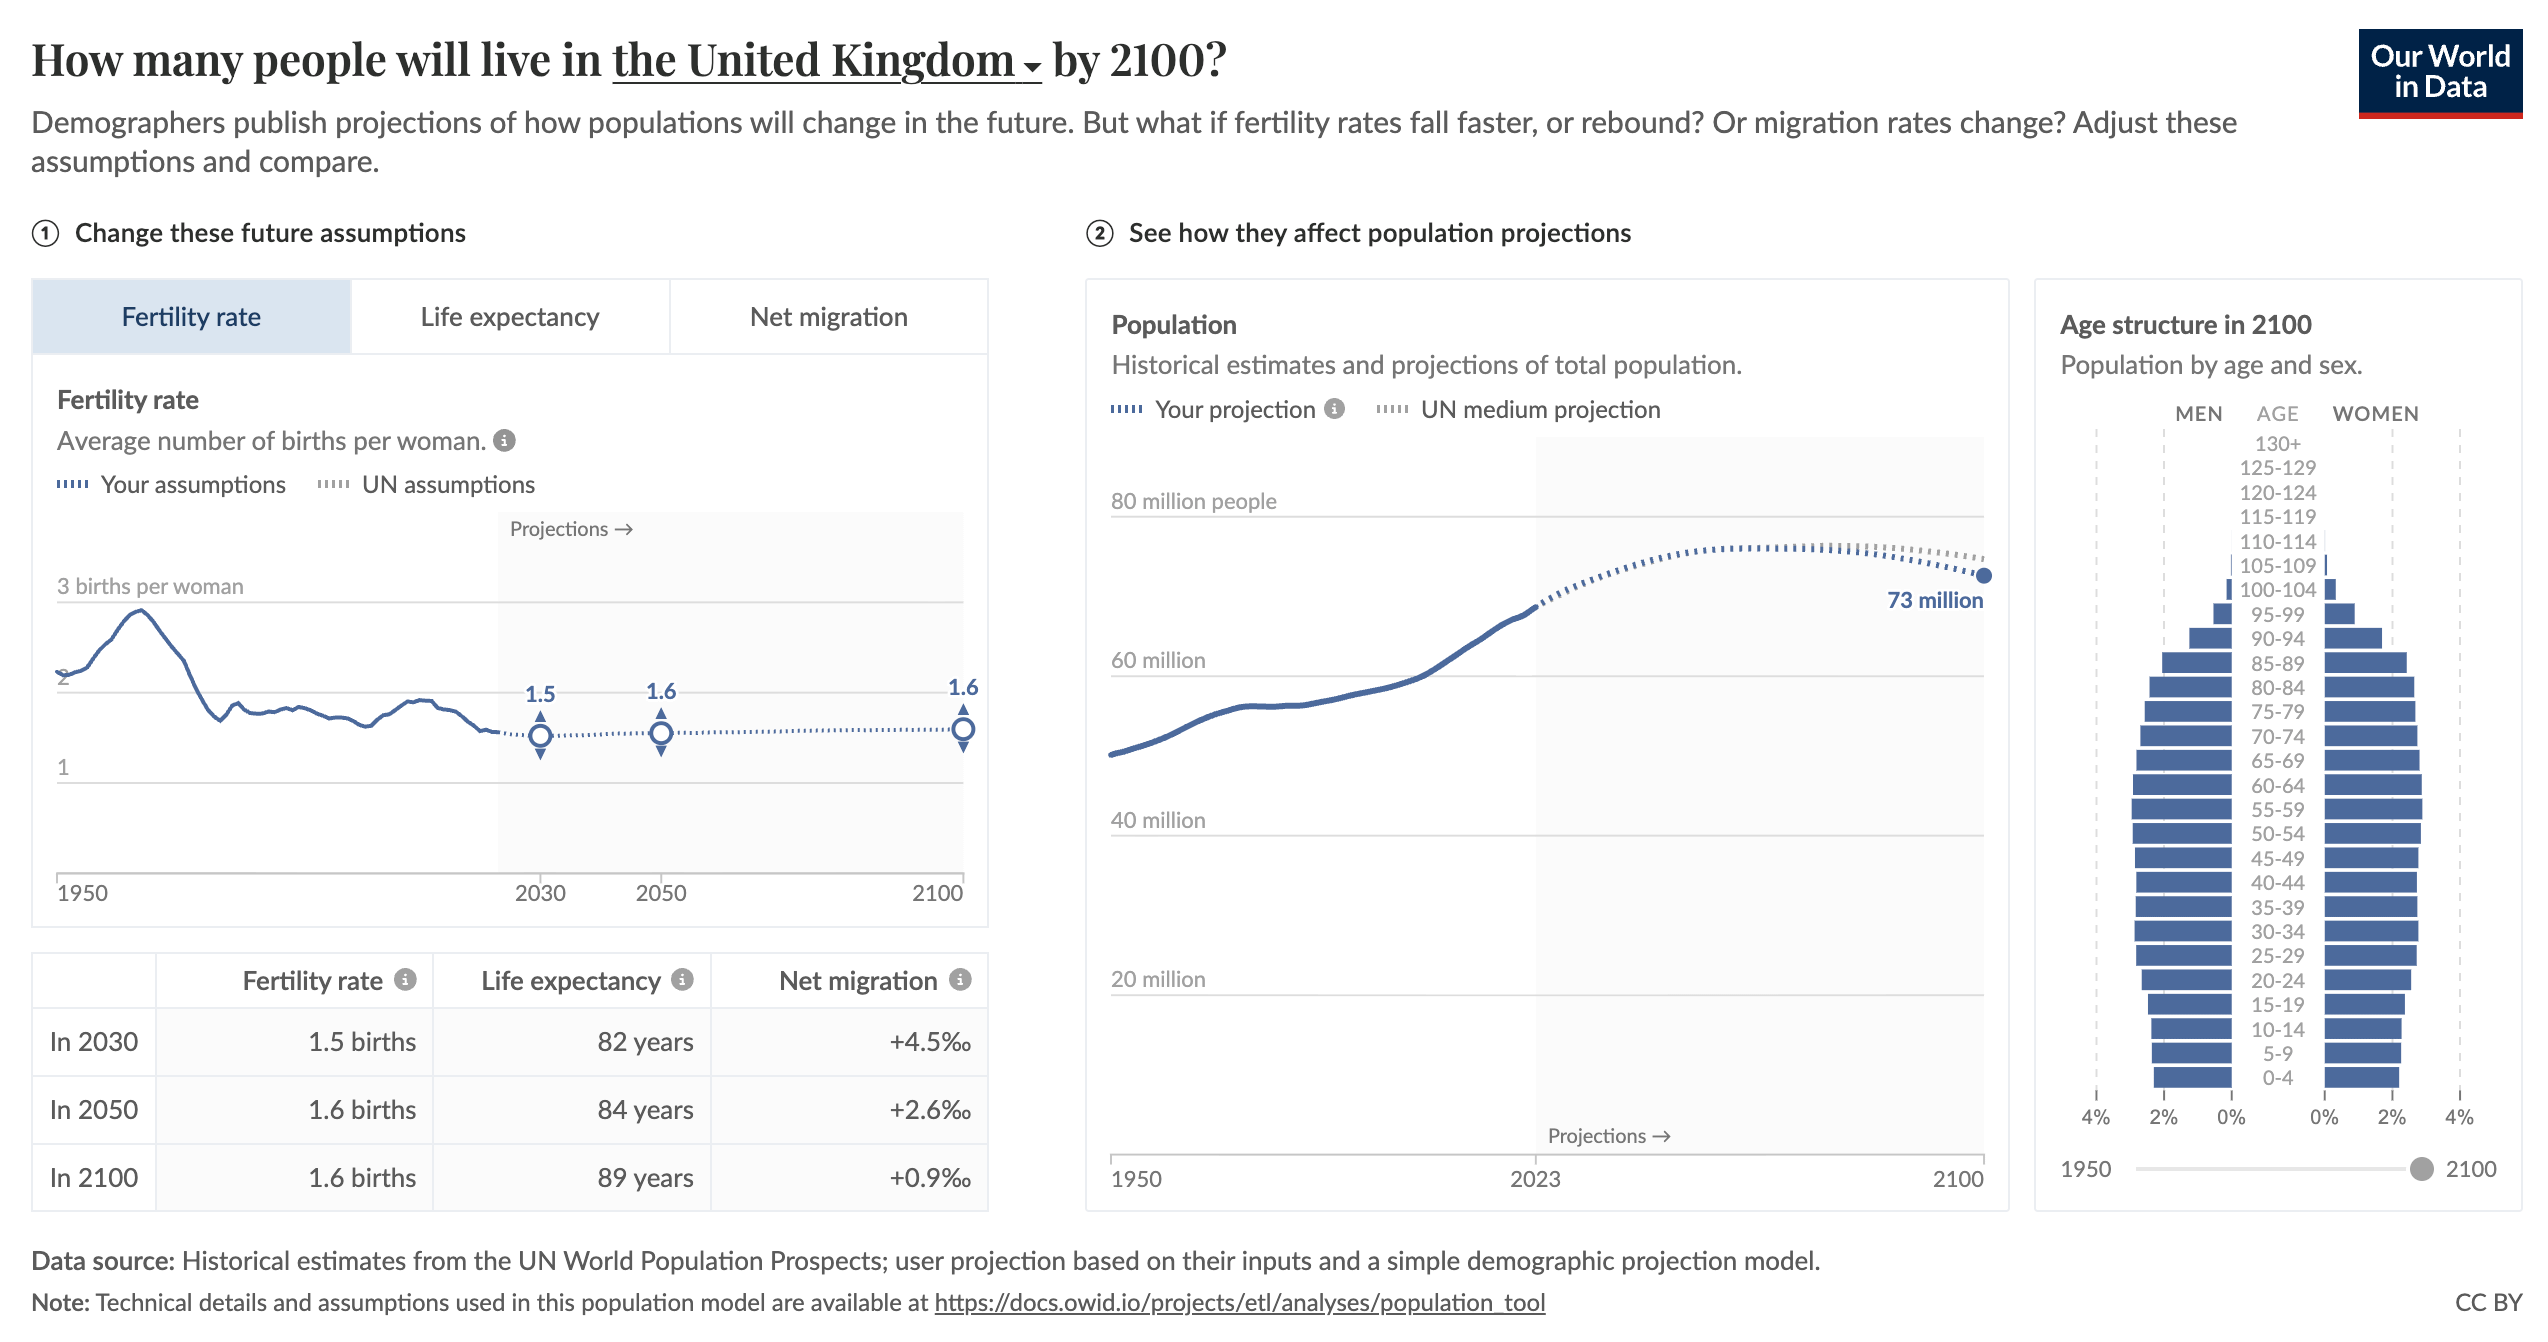
It can be fun and informative to play around with what the future might look like. At Our World in Data, we have built a population simulation tool that lets you do this (kudos to Daniel Bachler and Sophia Mersmann).
It’s a relatively simple model (but stacks up pretty well when we tested it against UN data). For any country, you can change three variables: fertility rates, life expectancy and net migration at three points of time in the future. You can then see how total population numbers change, alongside the population pyramid.
I gave the tool a go, asking the question: “What would it take to stop South Korea’s population from shrinking?” The article is here.
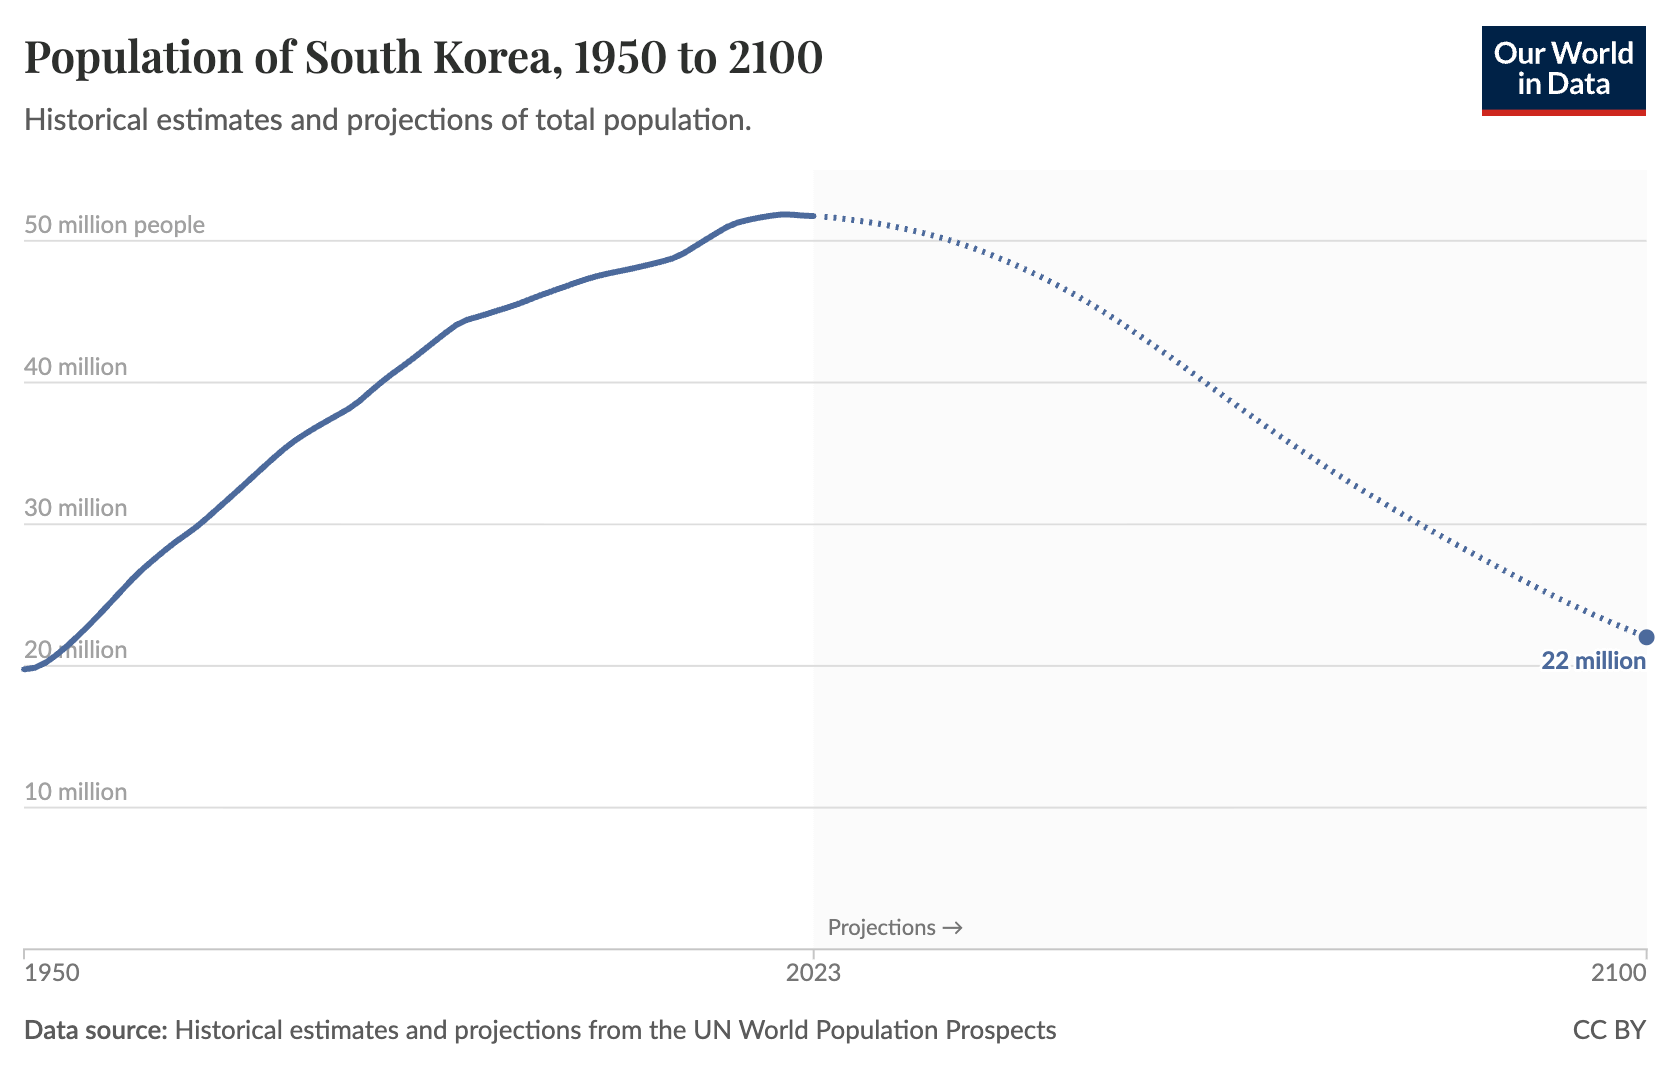
TLDR: to achieve it through life expectancy gains or migration would require really unprecedented change (by that, I mean average life expectancy increasing rapidly to 130 years).3 Neither will happen to that extent.
Fertility rates would need to rapidly increase from 0.7 children to 2.1 per woman, and stay there for the rest of the century. Perhaps more plausible than the other options, but still extremely unlikely.
Hopefully, you find the tool useful in exploring more questions like this.
Here, “fertility” rates measures the number of children that women choose to have. This is not to be confused with the biological use of the term “fertility”, which is to do with one’s ability to conceive.
We present the UN’s historical estimates and projection scenarios a lot in our work on population and demography. You can explore all of this data here.
A quirky outcome of this assumption is that you get to the point where there are basically no deaths in South Korea in most years.
What's the age distribution that is used for immigration?
RU insane? 363,000 born today, minus 174,000 deaths = 189,000 NET NEW HUMANS! With the current massive human overpopulation, and consequential heat energy production, we will have burned-up by 2,100! YOU ARE EITHER AN EMPLOYEE OF BIG OIL OR NAIVE', or just STUPID. We are 3,000 times more numerous today than were our migratory Hunter-Gatherer ancestral clan/band members, and we have been engineered as maximal consumers of natural resources and energy (coal, oil, gas, sunlite, wind). We/you are at the end of time and Gaia is expecting our extinction shortly.