

For a long time, the “U-shaped curve” has been a dominant framework in the research on happiness. As the theory goes, happiness scores tend to follow a U-shape with age: people are happiest when they’re young, become less so into middle-age, and things pick up again in their later years.
This was often presented as a universal pattern across countries. This theory has always had its critics, but even the researchers who coined it have begun to question whether the U has disappeared over the last decade or so.1
I thought I’d take a look at how happiness or life satisfaction varies by age in the latest surveys.
Here, I’ve taken data on life satisfaction from the latest World Happiness Report.2 This survey asks people to place themselves on a ladder from 0 to 10, where 0 is the absolute worst life for them, and 10 is the best. So it’s self-reported and obviously imperfect, but it’s a widely used survey question in happiness research.3
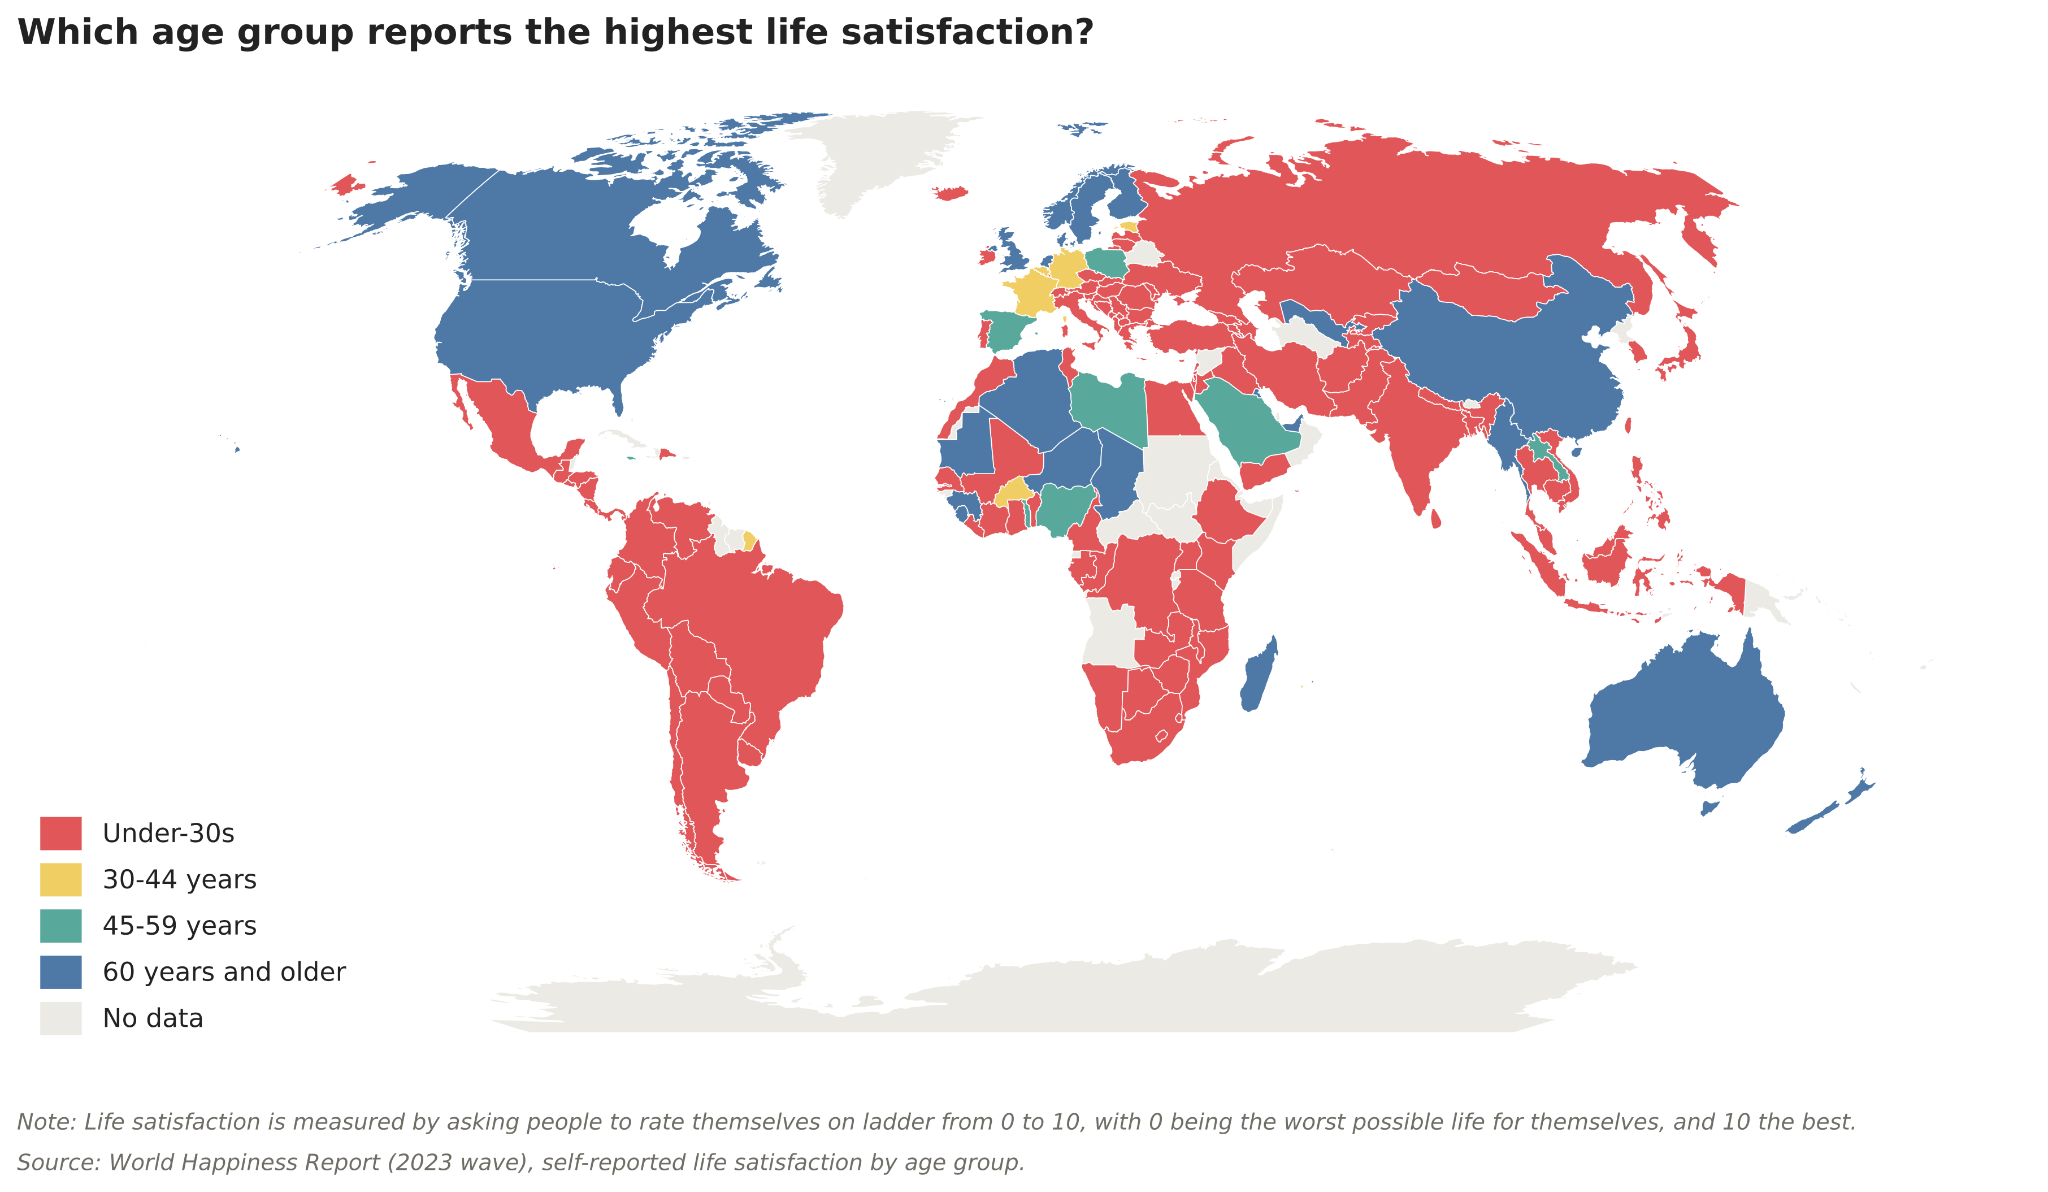
Which age group are the most satisfied with their lives? I’ve plotted this on the map below.
Most of the map is red, indicating that those under 30 were happiest. But you also see quite a bit of blue, where the over-60s were. This appears to be mostly English-speaking countries (the Anglosphere): the United States, Canada, Australia, New Zealand, and the United Kingdom. Several Nordic countries — Norway, Sweden, and Finland — stand out too; despite English not being their first language, they’re sometimes included in the “English-speaking” bucket because fluency there is so high.
Of course, there is a smattering of other countries where the oldest age group are the happiest, but the Anglosphere pattern stands out quite clearly.4
But this binary categorisation doesn’t give us the signal we need to know whether the gaps between age groups are significant. The under-30s or over-60s could have a higher score by a tiny margin that is next to meaningless.
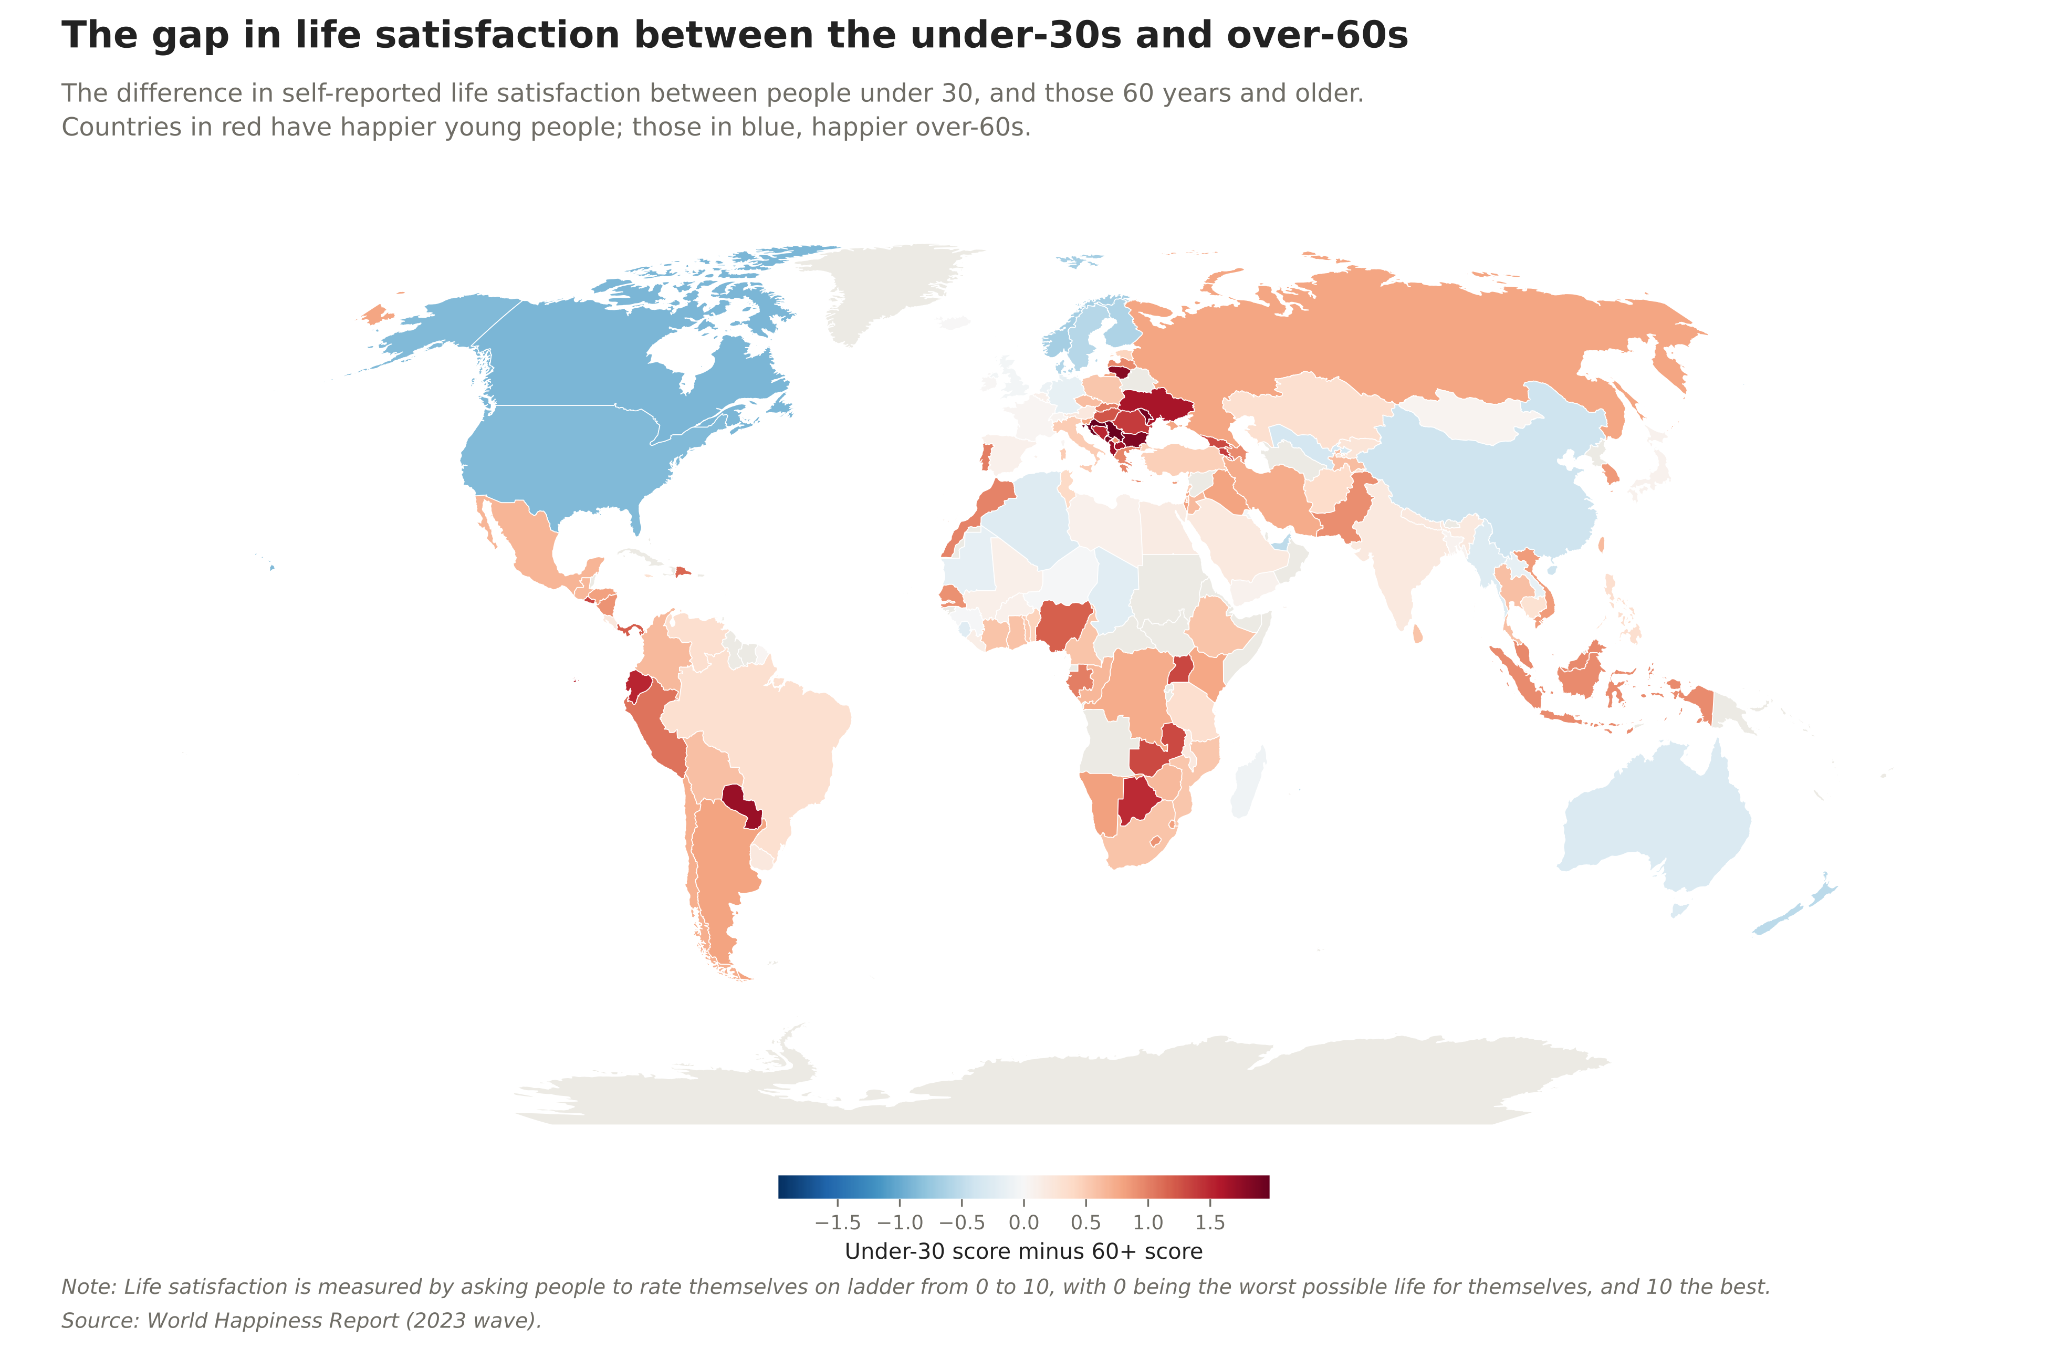
So, in the map below, I’ve plotted the gap in scores between the youngest and oldest age groups. Countries in blue have happier older people; those in red, happier youth. A stronger colour indicates a larger gap.
Already, we see that the difference is almost meaningless in some countries. The UK is a good example. It’s so faint it almost disappears. This isn’t true for the US and Canada, where young people appear to be pretty far behind. The opposite is true in Eastern Europe, where young people appear to be very far ahead.
But we can highlight these differences even further in our final chart, which plots each of the four age groups across a selection of countries. These scores are plotted on our 0-to-10 ladder; those further to the right are the happiest.
We see clearly that the over-60s are happiest in our Anglosphere set: Canada, the US, New Zealand, and Australia. And for the US and Canada, the gap is particularly big.
It’s now clear why the UK almost disappeared from our previous map: all of its age groups have a strikingly similar score. There’s basically nothing to pick between any of them. This is also true for countries like France and Spain.
At the other end of the spectrum, we have countries like Greece and Croatia. There, young people are much happier than the over-60s. In Croatia, by roughly two points on this scale. Given that scores tend to cluster somewhere in the 4 to 8 range in most countries, a two-point difference is genuinely huge.
You’ll notice that at least for this selection of countries, there isn’t much evidence of a U-shape. Countries tend to follow a sloping line in one direction or the other: either the youth are happiest, and scores progressively drop with age, or the opposite. It’s rarely the case that the under-30s and the over-60s get the highest scores, and those in their 30s, 40s, and 50s are far behind.
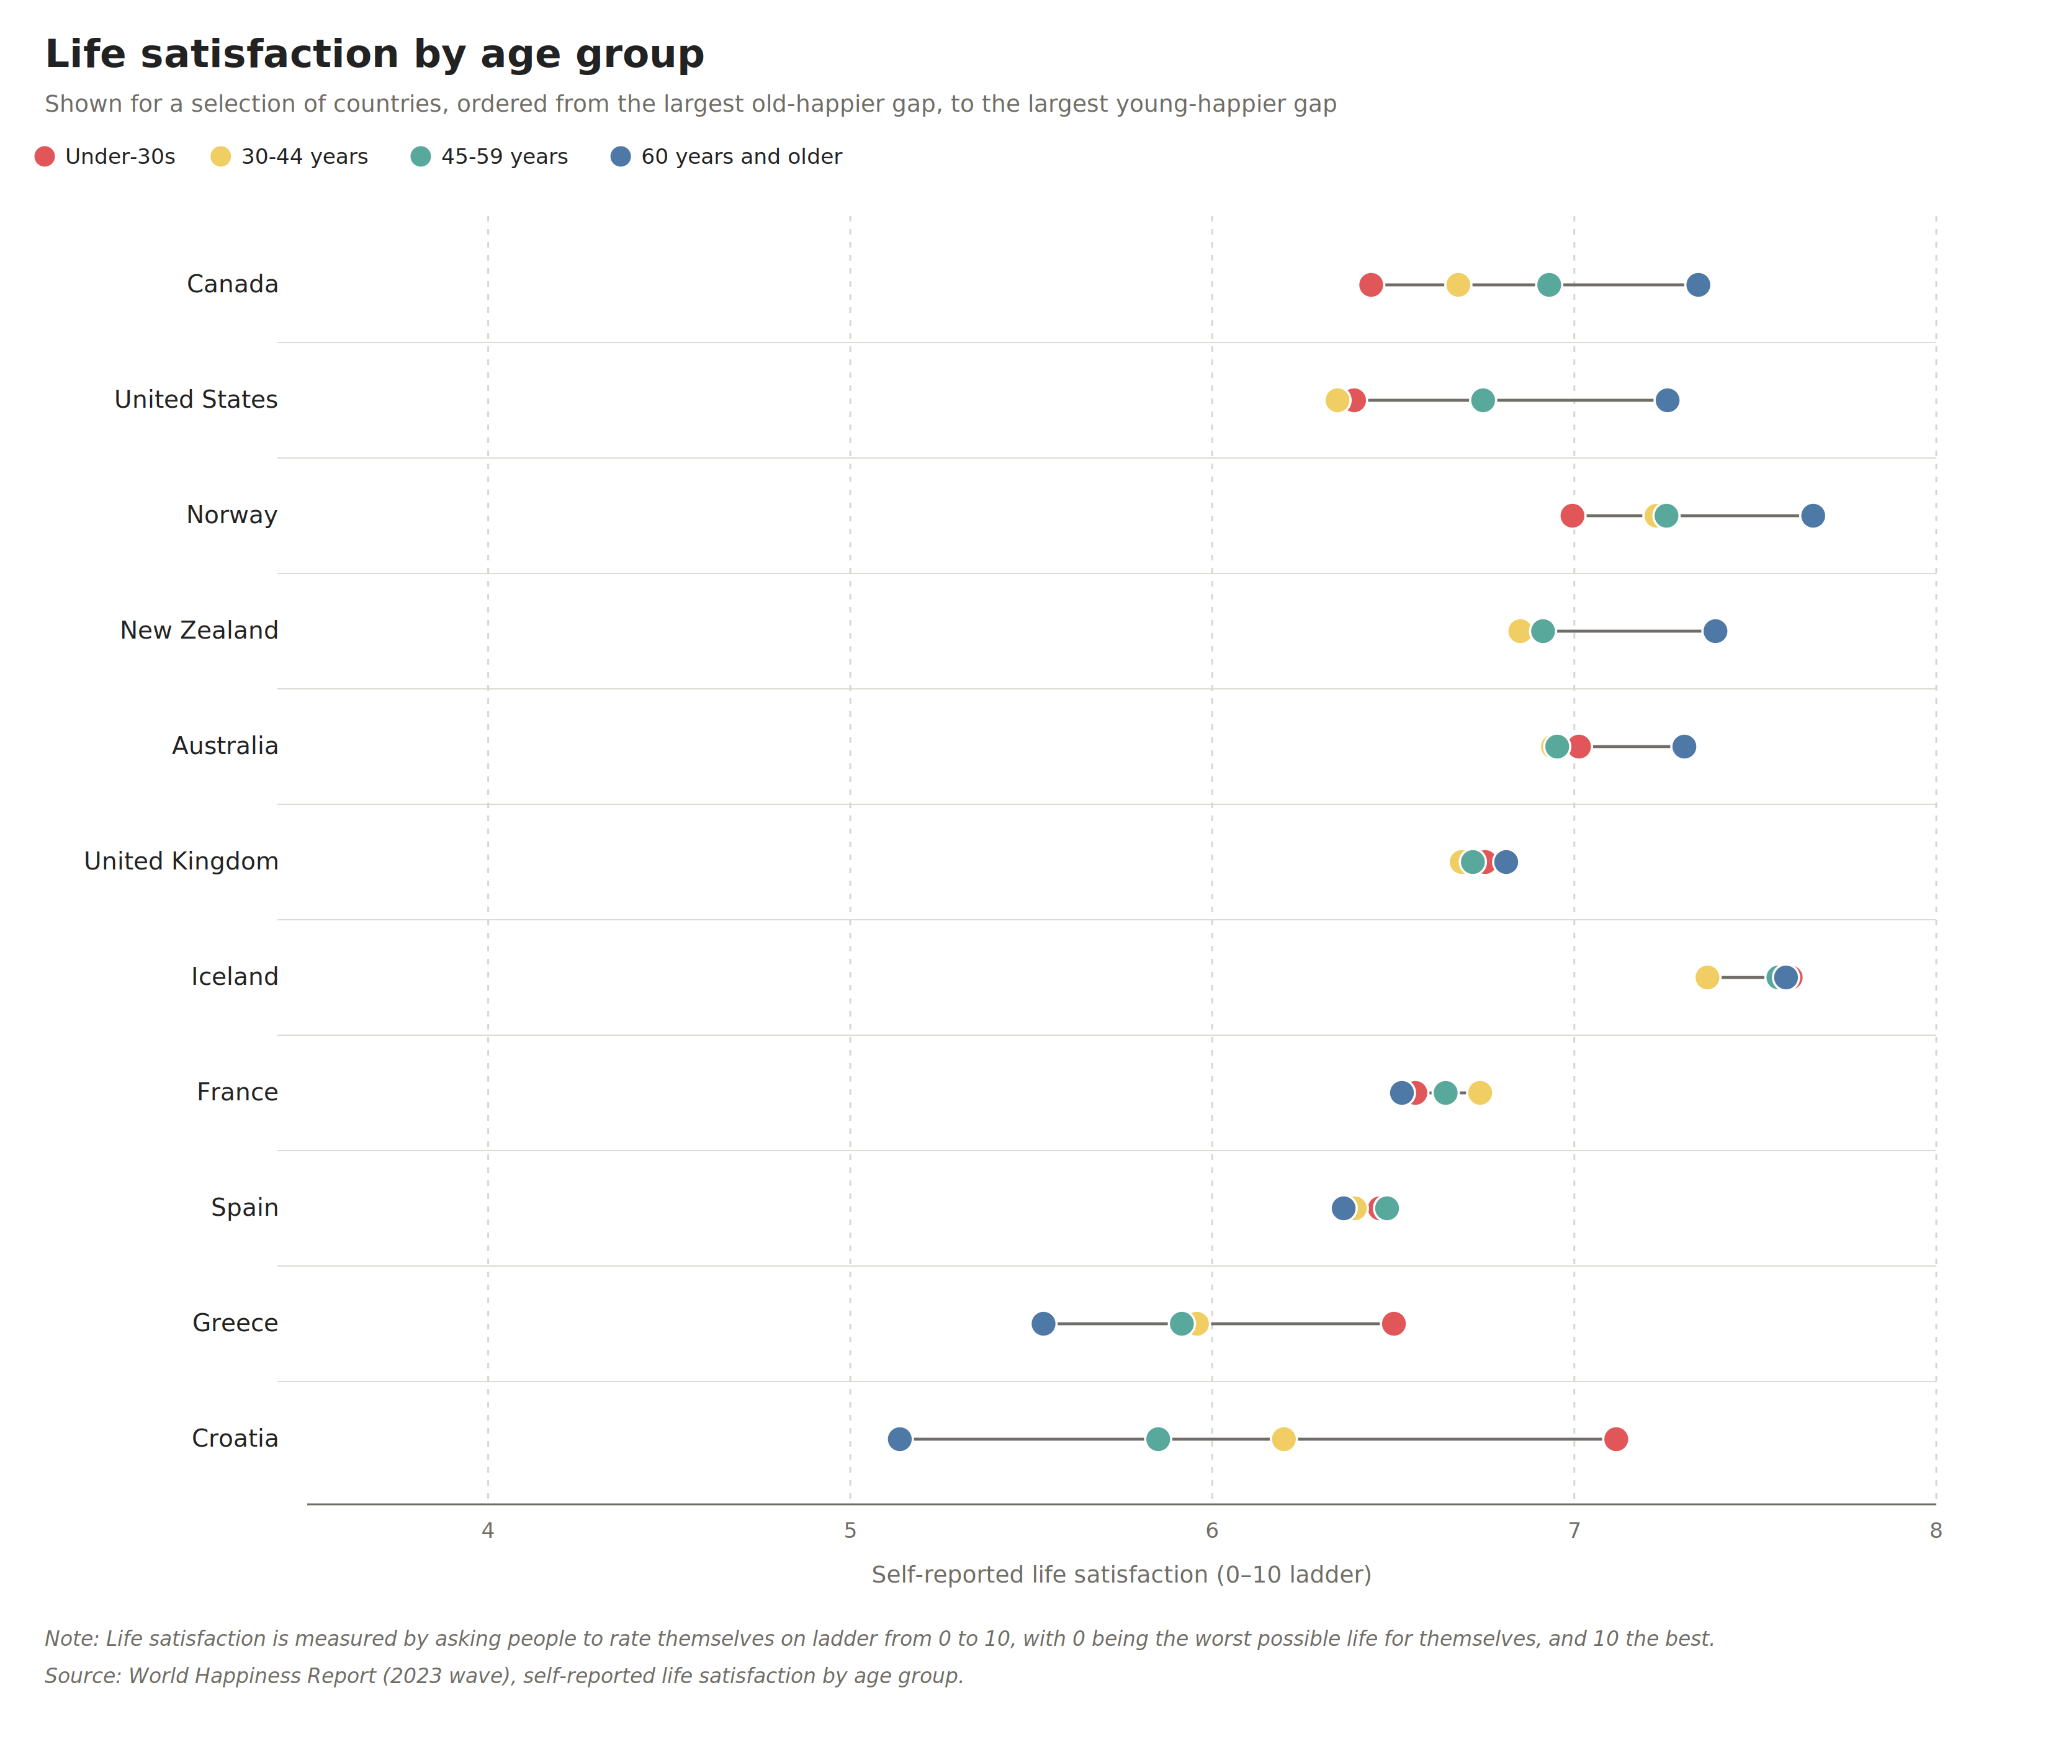
This chart not only allows us to see the differences within a given country, but also to compare across countries. Young people in Croatia, for example, are not just far happier than their older peers, but also happier than young people in every other country on this chart (except Iceland).
These differences become clear when we stack countries up in the rankings.
Across the entire population, Croatia is the 63rd-happiest country in the world. But among young people, it sits in 14th, and among the oldest cohort, it slips to 80th.
The US is the 23rd happiest in the overall rankings, but its over-60s actually break into the top 10, while its youngest fall all the way down to 62nd. For such a rich country, its youth ranking is really very poor.
The obvious question is why these contrasting patterns exist. Explaining why younger people in Croatia are happier seems a bit more straightforward. This pattern of the young being much happier is concentrated in post-communist countries: Croatia, Serbia, Moldova, Montenegro, and Bulgaria. Croatia also had its war of independence in the early 1990s, when the former Yugoslavia broke apart. Older generations have lived through a pretty tumultuous and traumatic time, while younger cohorts have lived through a period of pretty rapid improvements, particularly in the last decade.
As to why younger people are unhappier in English-speaking countries: I won’t pretend to have a concrete answer. I haven’t found a convincing explanation that doesn’t have lots of holes when you look at the research and other slices of the data. “It’s the phones” is the obvious answer, but there are lots of ways in which that argument falls through. Perhaps that is an article for another day.
Blanchflower, D. C., & Bryson, A. (2025). Life satisfaction in Western Europe and the gradual vanishing of the U-shape in age. Academia Mental Health and Well-Being, 2(3).
Blanchflower, D. G., Bryson, A., & Xu, X. (2025). The declining mental health of the young and the global disappearance of the unhappiness hump shape in age. PloS one, 20(8), e0327858.
This data comes from the 2024 edition of the World Happiness Report. There is a newer edition (2026), but this does not provide the same breakdowns by age.
From this point on, I’ll use the terms “life satisfaction” and “happiness” interchangeably. There’s a valid criticism that these are not exactly the same thing, but repeating “self-reported life satisfaction” will probably be quite annoying to read…
There are also a handful of countries where those in their 30s or 40s appear to be happiest.
May I just say that I love how your blog is essentially a class and how to read charts and make a good charts even though you never explicitly say that.
So many factors, but young people are certainly rational to be pessimistic. The future is bleak due to climate change and an aging population. They know that for the majority of them, in all likelihood, by the time they are 65 there will be no pension system for them, they can't afford a house, they can't afford to have kids and the planet will be on fire.
During the financial crash my dad said to me along the lines of "why should the next generation be better off than the last?" He's a boomer and somewhat left wing, and that was his attitude to the world going to the dogs. That's a little microcosm of the problem.